Description: PNG image
|
| From: | lynx . abraxas |
| Subject: | No "square" plotting in 3d any more?! |
| Date: | Mon, 10 Dec 2012 18:38:32 +0100 |
| User-agent: | Mutt/1.5.21 (2010-09-15) |
Hello!
It seems to me that it is not possible any more to plot in 3D (scatter3) and
display or save the result "square" (axis ("square")), at least I could not
find a way. It used to work with octave 2.x and setting the gnuplot_binary to
use the Xorg param ‐geometry to display in a square window ("/usr/bin/gnuplot
‐geometry 800x800 "). This seems not possibple in 3.x any more. I tried to use
fltk (graphics_toolkit fltk) which works as expected for viewing but only
saves a small viewport of the figure to a file. Anyway, I prefer gnuplot style
so I wonder if there is some trick to get 3d plots saved with equally scaled
axes (i.e. square)?
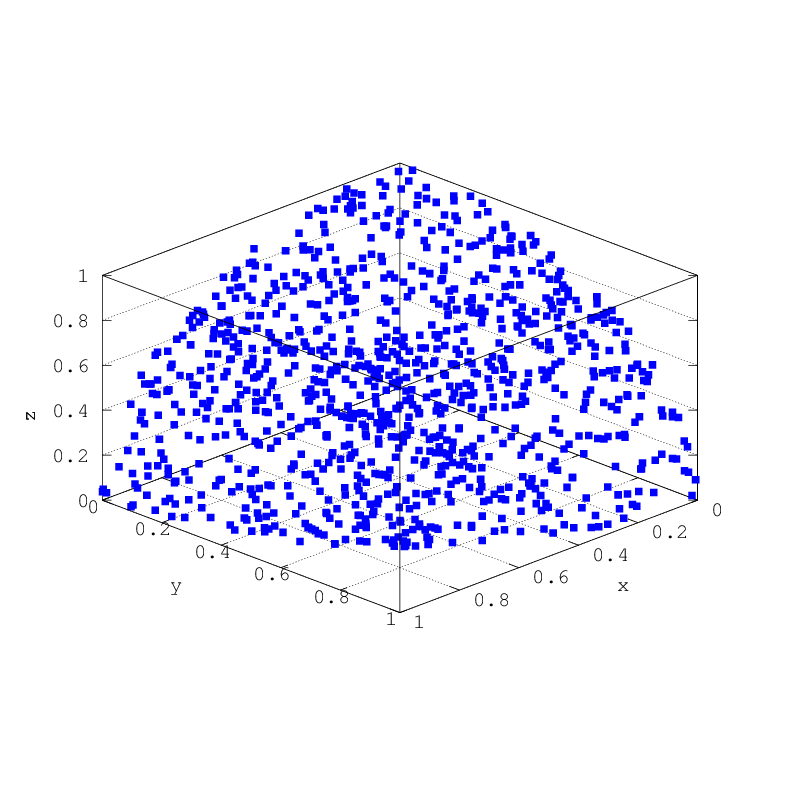
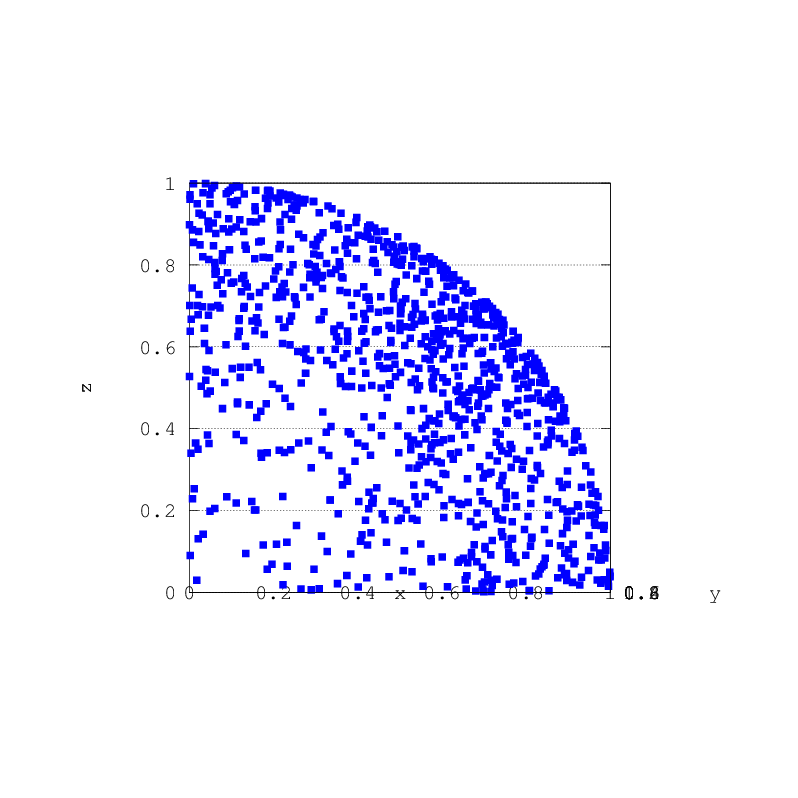
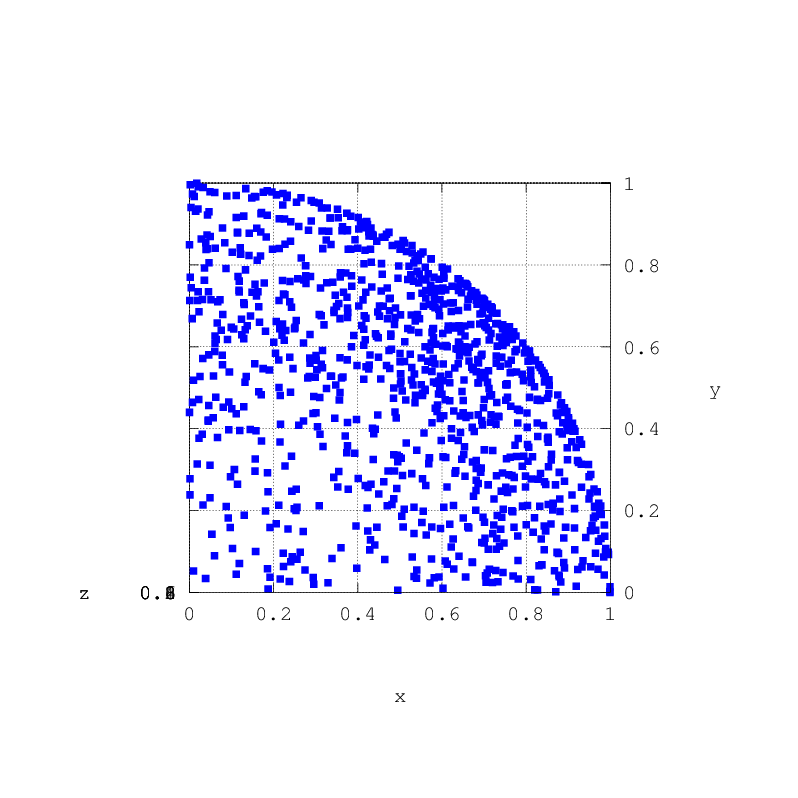
Below is a little test program. I’ve attached its output images. As long as
the plot is not viewed along one of the axes the z axis is not equally scaled
as the x and y axes (e.g. number *01* and *02*). I tried octave 3.6.2 and
3.4.3. Gnuplot itself can still do this with "set view equal xyz".
Thanks for any help or hints
Lynx
###program to test equidistant 3D plottting of a quater unit sphere
clear all;
num= 1001;
nplot=0;
quiet=0;
# arg_list = argv ();
# outGO=sprintf("%s_GO", arg_list{0});
outGO="test_3d_eqplotting_01"
#graphics_toolkit fltk; #for octave 3.6.2, nice for viewing but not saving
graphics_toolkit gnuplot;
#gnuplot_binary ("~/scripts/octave_gnuplot_exec"); #for octave 3.6.2
#set size square
#set (gca, "PlotBoxAspectRatioMode", "manual", "PlotBoxAspectRatio", [1 1 1]);
#figure, set(gca,'Size',"square"); #for octave 3.6.2, has no the ef
#figure, set(gcf,'position',[100 100 800 800]); #for octave 3.6.2, has no the
effect of gnuplot> set size square
#gnuplot_binary ("gnuplot", "set size square"); #for octave 3.6.2
#gnuplot_binary ("gnuplot", "geometry 800x800"); #for octave 3.6.2
#gnuplot_binary ("/usr/bin/gnuplot -geometry 800x800 ");
#gnuplot_binary ("GNUTERM=wxt gnuplot -geometry 800x800");
#gnuplot_binary ("sed 's/ pt 6 / pt 5 /g' | gnuplot -geometry 800x800");
#gnuplot_binary ("tee octave.gp | gnuplot -V");
#gnuplot_binary ('tee octave.gp');#this is not possible, octave checks for
gnuplot version!
#gset terminal dump
set (0, 'defaulttextfontname', 'arial');
xyz_r=rand(3, num);
#sph. for stereog. proj.
clear xt yt zt;
[xt, yt, zt]= cart2sph (xyz_r(1,:), xyz_r(2,:), xyz_r(3,:));#projection of 3D
guide points onto unit sphere
[xt, yt, zt]= sph2cart (xt, yt, ones(1,num));#projection of 3D points onto unit
sphere
xyz= vertcat (xt, yt, zt);
clear xt yt zt;
set(gca,'dataaspectratio',[1, 1, 1]);
set(gcf,'position',[100 100 800 800]);
set(gcf,'papersize',[11 11]);
set(gcf,'resize', 'off');
scatter3 (xyz(1,:), xyz(2,:), xyz(3,:), 10, "blue", 's', 'filled')#for octave
3.6.2
#plot3 (xyz(1,:), xyz(2,:), xyz(3,:), "k")
axis ([0,1,0,1,0,1], "square");
xlabel("x");
ylabel("y");
zlabel("z");
azimuth= 135;
#azimuth= 315;
elevation= acosd(dot([1,1,1], [1,1,0])/(norm([1,1,1]) * norm([1,1,0])));
#elevation= elevation + 90;
view(azimuth, elevation);
#set(gcf,'position',[100 100 800 800]);
####printing now...
nplot= nplot + 1;
if !quiet
printf("Printing plot # %d", nplot)
endif
print(sprintf("%s_%.2d.png", outGO, nplot), '-dpng', '-S800,800');#,
'-F/usr/X11R6/lib/X11/fonts/msttf/arial.ttf');#, '-r100');
print(sprintf("%s_%.2d.svg", outGO, nplot), '-dsvg', '-S800,800');#has to be
there for axis ("square") to work even with svg (-S not possible any more with
gnuplot > 4.3.0 ???)
if !quiet
printf(" done.\n", nplot)
endif
####printing end
view(110, 10);
####printing now...
nplot= nplot + 1;
if !quiet
printf("Printing plot # %d", nplot)
endif
print(sprintf("%s_%.2d.png", outGO, nplot), '-dpng', '-S800,800');#,
'-F/usr/X11R6/lib/X11/fonts/msttf/arial.ttf');#, '-r100');
print(sprintf("%s_%.2d.svg", outGO, nplot), '-dsvg', '-S800,800');#has to be
there for axis ("square") to work even with svg (-S not possible any more with
gnuplot > 4.3.0 ???)
if !quiet
printf(" done.\n", nplot)
endif
####printing end
view(0, 0);
####printing now...
nplot= nplot + 1;
if !quiet
printf("Printing plot # %d", nplot)
endif
print(sprintf("%s_%.2d.png", outGO, nplot), '-dpng', '-S800,800');#,
'-F/usr/X11R6/lib/X11/fonts/msttf/arial.ttf');#, '-r100');
print(sprintf("%s_%.2d.svg", outGO, nplot), '-dsvg', '-S800,800');#has to be
there for axis ("square") to work even with svg (-S not possible any more with
gnuplot > 4.3.0 ???)
if !quiet
printf(" done.\n", nplot)
endif
####printing end
view(0, 90);
####printing now...
nplot= nplot + 1;
if !quiet
printf("Printing plot # %d", nplot)
endif
print(sprintf("%s_%.2d.png", outGO, nplot), '-dpng', '-S800,800');#,
'-F/usr/X11R6/lib/X11/fonts/msttf/arial.ttf');#, '-r100');
print(sprintf("%s_%.2d.svg", outGO, nplot), '-dsvg', '-S800,800');#has to be
there for axis ("square") to work even with svg (-S not possible any more with
gnuplot > 4.3.0 ???)
if !quiet
printf(" done.\n", nplot)
endif
####printing end
![]() test_3d_eqplotting_01_01.png
test_3d_eqplotting_01_01.png
Description: PNG image
![]() test_3d_eqplotting_01_02.png
test_3d_eqplotting_01_02.png
Description: PNG image
![]() test_3d_eqplotting_01_03.png
test_3d_eqplotting_01_03.png
Description: PNG image
![]() test_3d_eqplotting_01_04.png
test_3d_eqplotting_01_04.png
Description: PNG image
| [Prev in Thread] | Current Thread | [Next in Thread] |