[Date Prev][Date Next][Thread Prev][Thread Next][Date Index][Thread Index]
Controlling quality of 3d plot
|
From: |
Oz Nahum |
|
Subject: |
Controlling quality of 3d plot |
|
Date: |
Mon, 18 May 2009 01:59:52 +0200 |
Hi,
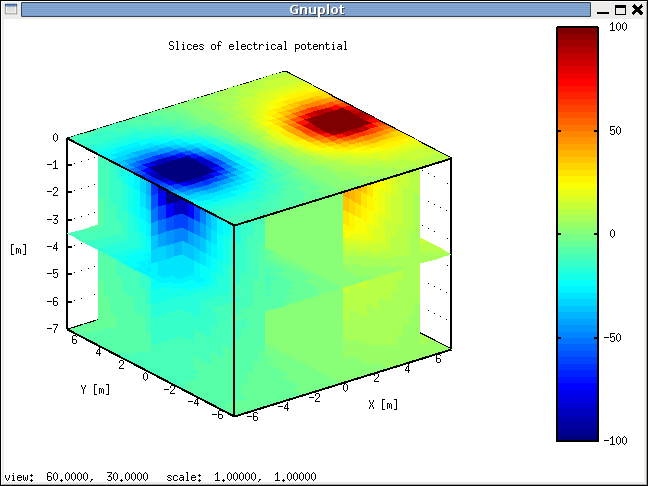
I was wondering how I can get a better quality images with octave.
Here is an example of image produce with matlab
And the same code produced a terrible picture with octave
I would like to change the sampling rate of the slices, and also be able to control the fonts displaying.
I use octave 3.0.5 on debian squeeze,
I attached also the code to produce the above plots
Thanks in advance for any help,
Oz.
--
----
Imagine there's no countries
It isn't hard to do
Nothing to kill or die for
And no religion too
Imagine all the people
Living life in peace
 Screenshot-Matlab.png
Description: PNG image
Screenshot-Octave.png
Description: PNG image
 Class_12_May.m
Description: Text Data
- Controlling quality of 3d plot,
Oz Nahum <=