[Date Prev][Date Next][Thread Prev][Thread Next][Date Index][Thread Index]
Re: Controlling quality of 3d plot
|
From: |
Miroslaw Kwasniak |
|
Subject: |
Re: Controlling quality of 3d plot |
|
Date: |
Tue, 19 May 2009 10:12:52 +0200 |
|
User-agent: |
Mutt/1.5.9i |
On Mon, May 18, 2009 at 01:59:52AM +0200, Oz Nahum wrote:
> Hi,
> I was wondering how I can get a better quality images with octave.
> Here is an example of image produce with matlab
> And the same code produced a terrible picture with octave
>
> I would like to change the sampling rate of the slices, and also be able to
> control the fonts displaying.
>
> I use octave 3.0.5 on debian squeeze,
> I attached also the code to produce the above plots
As I see in octave + gnuplot (in my case Debian/Lenny has 3.0.1+4.2.2 )
"shading interp" doesn't work as you expect.
You have two solutions:
- use dense sample or interpolated field
- switch from gnuplot to jhandles
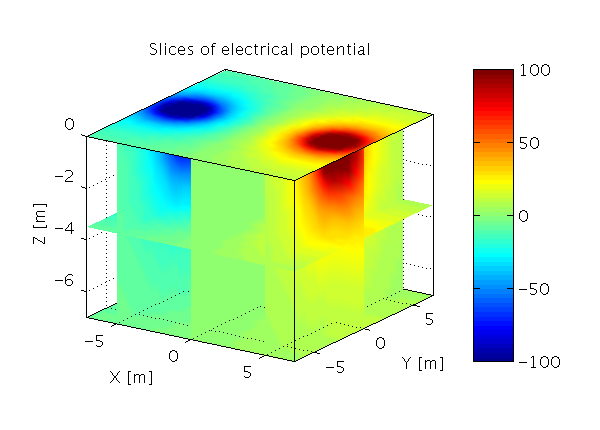
I've attached picture produced by your script with jhandles.
 octave_jhandles.png
Description: PNG image