[Date Prev][Date Next][Thread Prev][Thread Next][Date Index][Thread Index]
Re: Axis layout of xyz in 3D plotting
|
From: |
Nicholas Jankowski |
|
Subject: |
Re: Axis layout of xyz in 3D plotting |
|
Date: |
Mon, 23 Aug 2021 12:15:43 -0400 |
> So no matter where this plot is viewed from, it is still a Left handed
> coordinate system.
the default in matlab is to produce a right handed coordinate system.
See the documentation for the properties XDir, YDir, and ZDir here:
https://www.mathworks.com/help/matlab/ref/matlab.graphics.axis.axes-properties.html
In the graphic for all three options set to 'normal', the x axis, y
axis, and z, axis all behave in a right handed fashion. the origin is
in the 'bottom' of the image. positive X goes to the right, positive y
goes to the left, positive z goes up. this matches your right-handed
triple graphic.
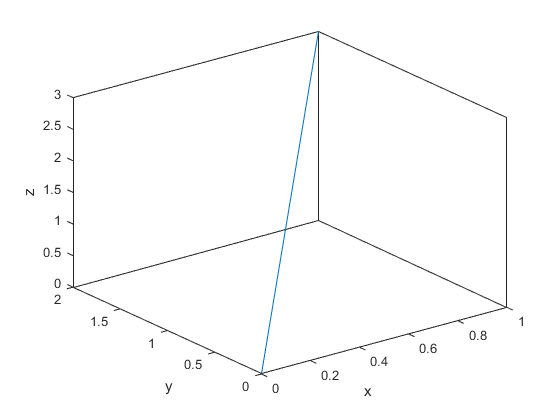
this set of commands:
plot3([0,1],[0,2],[0,3]);xlabel('x');ylabel('y'),zlabel('z');box on;
in both Octave and Matlab produce right hand ruled plots like the
first attached image.
rotating the view about the z axis to get positive x axis 'down left'
and the y axis 'down right' using the command: view([1 1 1]). this
puts the origin at the 'center' point in the plot
the orientation you said you wanted for a textbook, with x 'down
left', y 'to the right', and z up can be gotten with something close
to
view([6 1 2])
see second attached image.
 image.png
Description: PNG image
image.png
Description: PNG image
- Axis layout of xyz in 3D plotting, Tee Nor, 2021/08/21
- Re: Axis layout of xyz in 3D plotting, Markus Mützel, 2021/08/21
- Message not available
- Re: Axis layout of xyz in 3D plotting, Markus Mützel, 2021/08/23
- Re: Axis layout of xyz in 3D plotting, Tee Nor, 2021/08/23
- Re: Axis layout of xyz in 3D plotting, Markus Mützel, 2021/08/23
- Re: Axis layout of xyz in 3D plotting, Tee Nor, 2021/08/23
- Re: Axis layout of xyz in 3D plotting, Markus Mützel, 2021/08/23
- Re: Axis layout of xyz in 3D plotting, Dmitri A. Sergatskov, 2021/08/23
- Re: Axis layout of xyz in 3D plotting,
Nicholas Jankowski <=