Description: PNG image
|
| From: | Markus Mützel |
| Subject: | Re: Axis layout of xyz in 3D plotting |
| Date: | Mon, 23 Aug 2021 18:01:57 +0200 |
Sorry, I probably was ambiguous:Please, show some self-contained code with which Octave produces a plot with left-handed coordinate system for you.MarkusGesendet: Montag, 23. August 2021 um 16:35 Uhr
Von: "Tee Nor" <tnor2048@gmail.com>
An: "Markus Mützel" <markus.muetzel@gmx.de>
Cc: help@octave.org
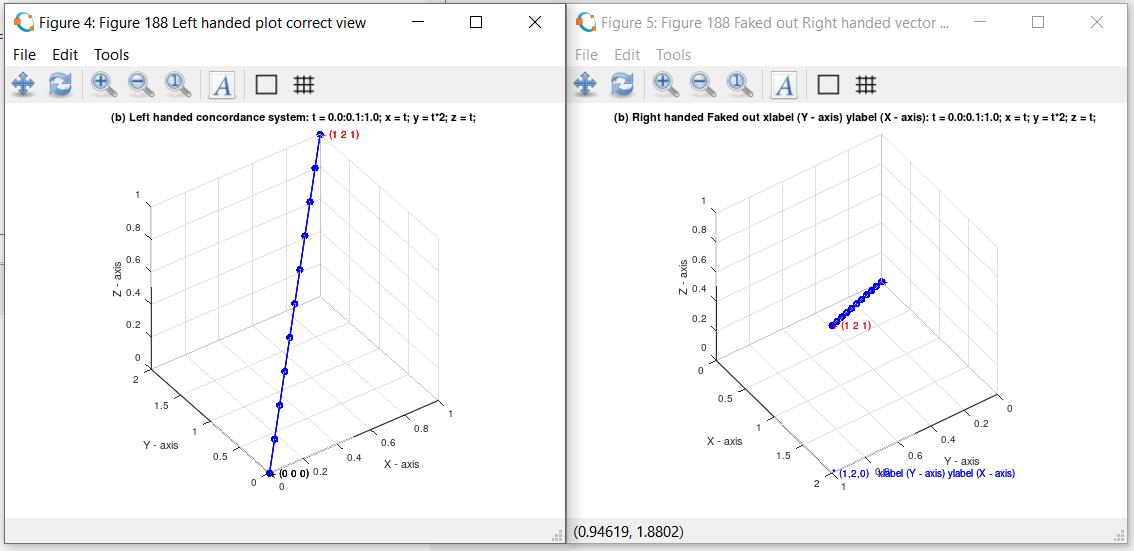
Betreff: Re: Axis layout of xyz in 3D plottingHello agian Markus,I am pleased you have taken interest.I have included an example of "undergraduate cross product textbook confusion".First you will see the mathematical (used in theatrical Electromagnetics) illustrationcommon to cross product vector analysis.Second is illustrations of simple changing the axis label to seemling correct this issue,By the way, this is not earth shattering news, I discovered this in Mathworks during the 90's.Please Be Careful not to be fooled by my trickery of Octave, it's for illustration only,There is nothing incorrect with Octave's workings. More of a wish list.Please note this is a simple single vector from 0,0,0 to 1,2,1 in all cases.In figure 4, this looks as seen Fig 188 (b). Here the orientation is view(145,-218) asalso the plot code (t,x,y,z) for the vector. However, if rotated back around, so thatit looks like Fig 188 (a), x axis and y axis move where y is left and x is right of the plot.Thus, Figure 5, I simple changed the xlabel and ylabel statements, and all is well,except x data is y data, and y data is x data. Completely incorrect, as shown.So no matter where this plot is viewed from, it is still a Left handed coordinate system.This is a very small detail, however, It's used during exam's to "weed out bell curve" types.I looked into changing this, and will take much time to introduce a switch to changebetween left and right coordinate systems.Please indicate any more missing information, I take a lot for granted in electromagnetics.Regards, TOn Mon, Aug 23, 2021 at 8:09 AM Markus Mützel <markus.muetzel@gmx.de> wrote:Please, keep the mailing list in CC.Octave's plotting system uses a right-handed coordinate system.If you'd like to switch to a left handed coordinate system, reverse one of the axes.Can you give an example where Octave uses a left-handed coordinate system when plotting for you?MarkusGesendet: Montag, 23. August 2021 um 13:27 Uhr
Von: "Tee Nor" <tnor2048@gmail.com>
An: "Markus Mützel" <markus.muetzel@gmx.de>
Betreff: Re: Axis layout of xyz in 3D plottingHello Markus,Thank you very much for the help. I installed Octave 6.3.0 on Vista,Apparently, On Debian 10.9.0 I'll have to re-build Octave 6.3.0 asDebian 10 Octave version is 4.4.1. This issue has not changed betweenversions.Please examine the included attachment:MathWorks (MathLab) and Octave are using the "Left-hand" coordinate system,so it is not currently possible to change to the "Right handed" system.In either case, the plots are correct as seen per the xyz numbers.As indicated by the preferred statement, while developing textbooks etc,the solution was to just leave out the axis information, avoiding confusion.In my last note, the location (1,1,1) of ijk in both (a) and (b) are the same,just flip (b) over, except x and y are swapped. Also, gui_mode() is nowconsidered an error in MS world. I do not plan to use MS.Suggest adding a setup switch between right and left hand option.Regards, TOn Sat, Aug 21, 2021 at 4:09 PM Markus Mützel <markus.muetzel@gmx.de> wrote:Am 21. August 2021 um 08:52 Uhr schrieb "Tee Nor":
> Has anyone noticed,
> Most math and physics textbooks have the positive axis arrowheads direction layout as follows:
> x axis arrow pointing down and to the left,
> y axis arrow pointing to the right,
> z axis arrow pointing to the top.
> Using GNU Octave version 3.6.2,
> Please show how to make my positive axis look this way.
> My view always looks like x and y are swapped.
> Regards, T
Octave 3.6.2 is ancient and I don't have access to it to test in that version.
In version 6.3.0, the following command seems to rotate the axes in the way you describe:
view ([100, 30]);
HTH,
Markus
![]() screenshot_example.PNG
screenshot_example.PNG
Description: PNG image
| [Prev in Thread] | Current Thread | [Next in Thread] |