[Date Prev][Date Next][Thread Prev][Thread Next][Date Index][Thread Index]
Re: QEMU Memory access- to get contents of register after each load/stor
|
From: |
Alan R Ford |
|
Subject: |
Re: QEMU Memory access- to get contents of register after each load/store |
|
Date: |
Fri, 15 Jan 2021 12:23:39 +1100 |
|
User-agent: |
Cyrus-JMAP/3.5.0-alpha0-45-g4839256-fm-20210104.001-g48392560 |
Hi Naomi,
Would running gdb to remotely debug the QEMU guest accomplish this? I'm assuming this code is running on the guest right? If you're determined to do this within QEMU rather than with gdb running alongside then please ignore my reply.
I suspect you might already know all these steps but I'm going to write them down for my benefit anyway.
To prepare QEMU to allow guest debugging with gdb add something like "-gdb tcp::1234" as well as "-S" to the end of your "qemu-system-arm" command then run as normal. You may also need to include the "-singlestep" option.
The "-gdb tcp:12345" parameter allows gdb on the same machine (or a remote machine) to connect to the gdbserver within QEMU on tcp port "12345" (you can change this number) and debug what's happening on the guest. The "-S" (that's a capital S) tells QEMU to not start the guest until gdb is connected and you've issued the "c" / "continue" command in gdb. The "-singlestep" option may be necessary while debugging so that tcg doesn't do any optimization that causes instructions to be skipped.
So after starting QEMU in one window, in another window start up gdb with
gdb -ex "target remote 127.0.0.1:12345"
Change 127.0.0.1 to the IP of the host running qemu if gdb is running on a different system.
Make sure your version of gdb supports "arm" architecture. If it doesn't you might get an error when starting up gdb complaining. You might need to use "gdb-multiarch" on some distros or "arm-none-eabi-gdb" on some others. To check if your version of gdb supports "arm" architecture run "gdb" then in the interactive mode type "set architecture" then hit <tab> to see what architectures your version of gdb supports. Hopefully "arm" is in there.
(gdb) set architecture <tab>
Display all 200 possibilities? (y or n) y
A6 armv8-a crisv32 i386 m68k:548x m68k:isa-c:mac mips:9000
A7 armv8-m.base .....
MicroBlaze avr:101 csky:ck807 iq2000 m68k:cfv4e mips:14000 mips:isa32r6
arm avr:102 csky:ck810 iwmmxt m68k:cpu32 mips:16 mips:isa64
arm_any ....
At this point in gdb I would suggest setting the layout so that you can see the assembly code being executed as well as the current register values changing. This can be done with the gdb command "layout regs". This step is optional.
(gdb) layout regs
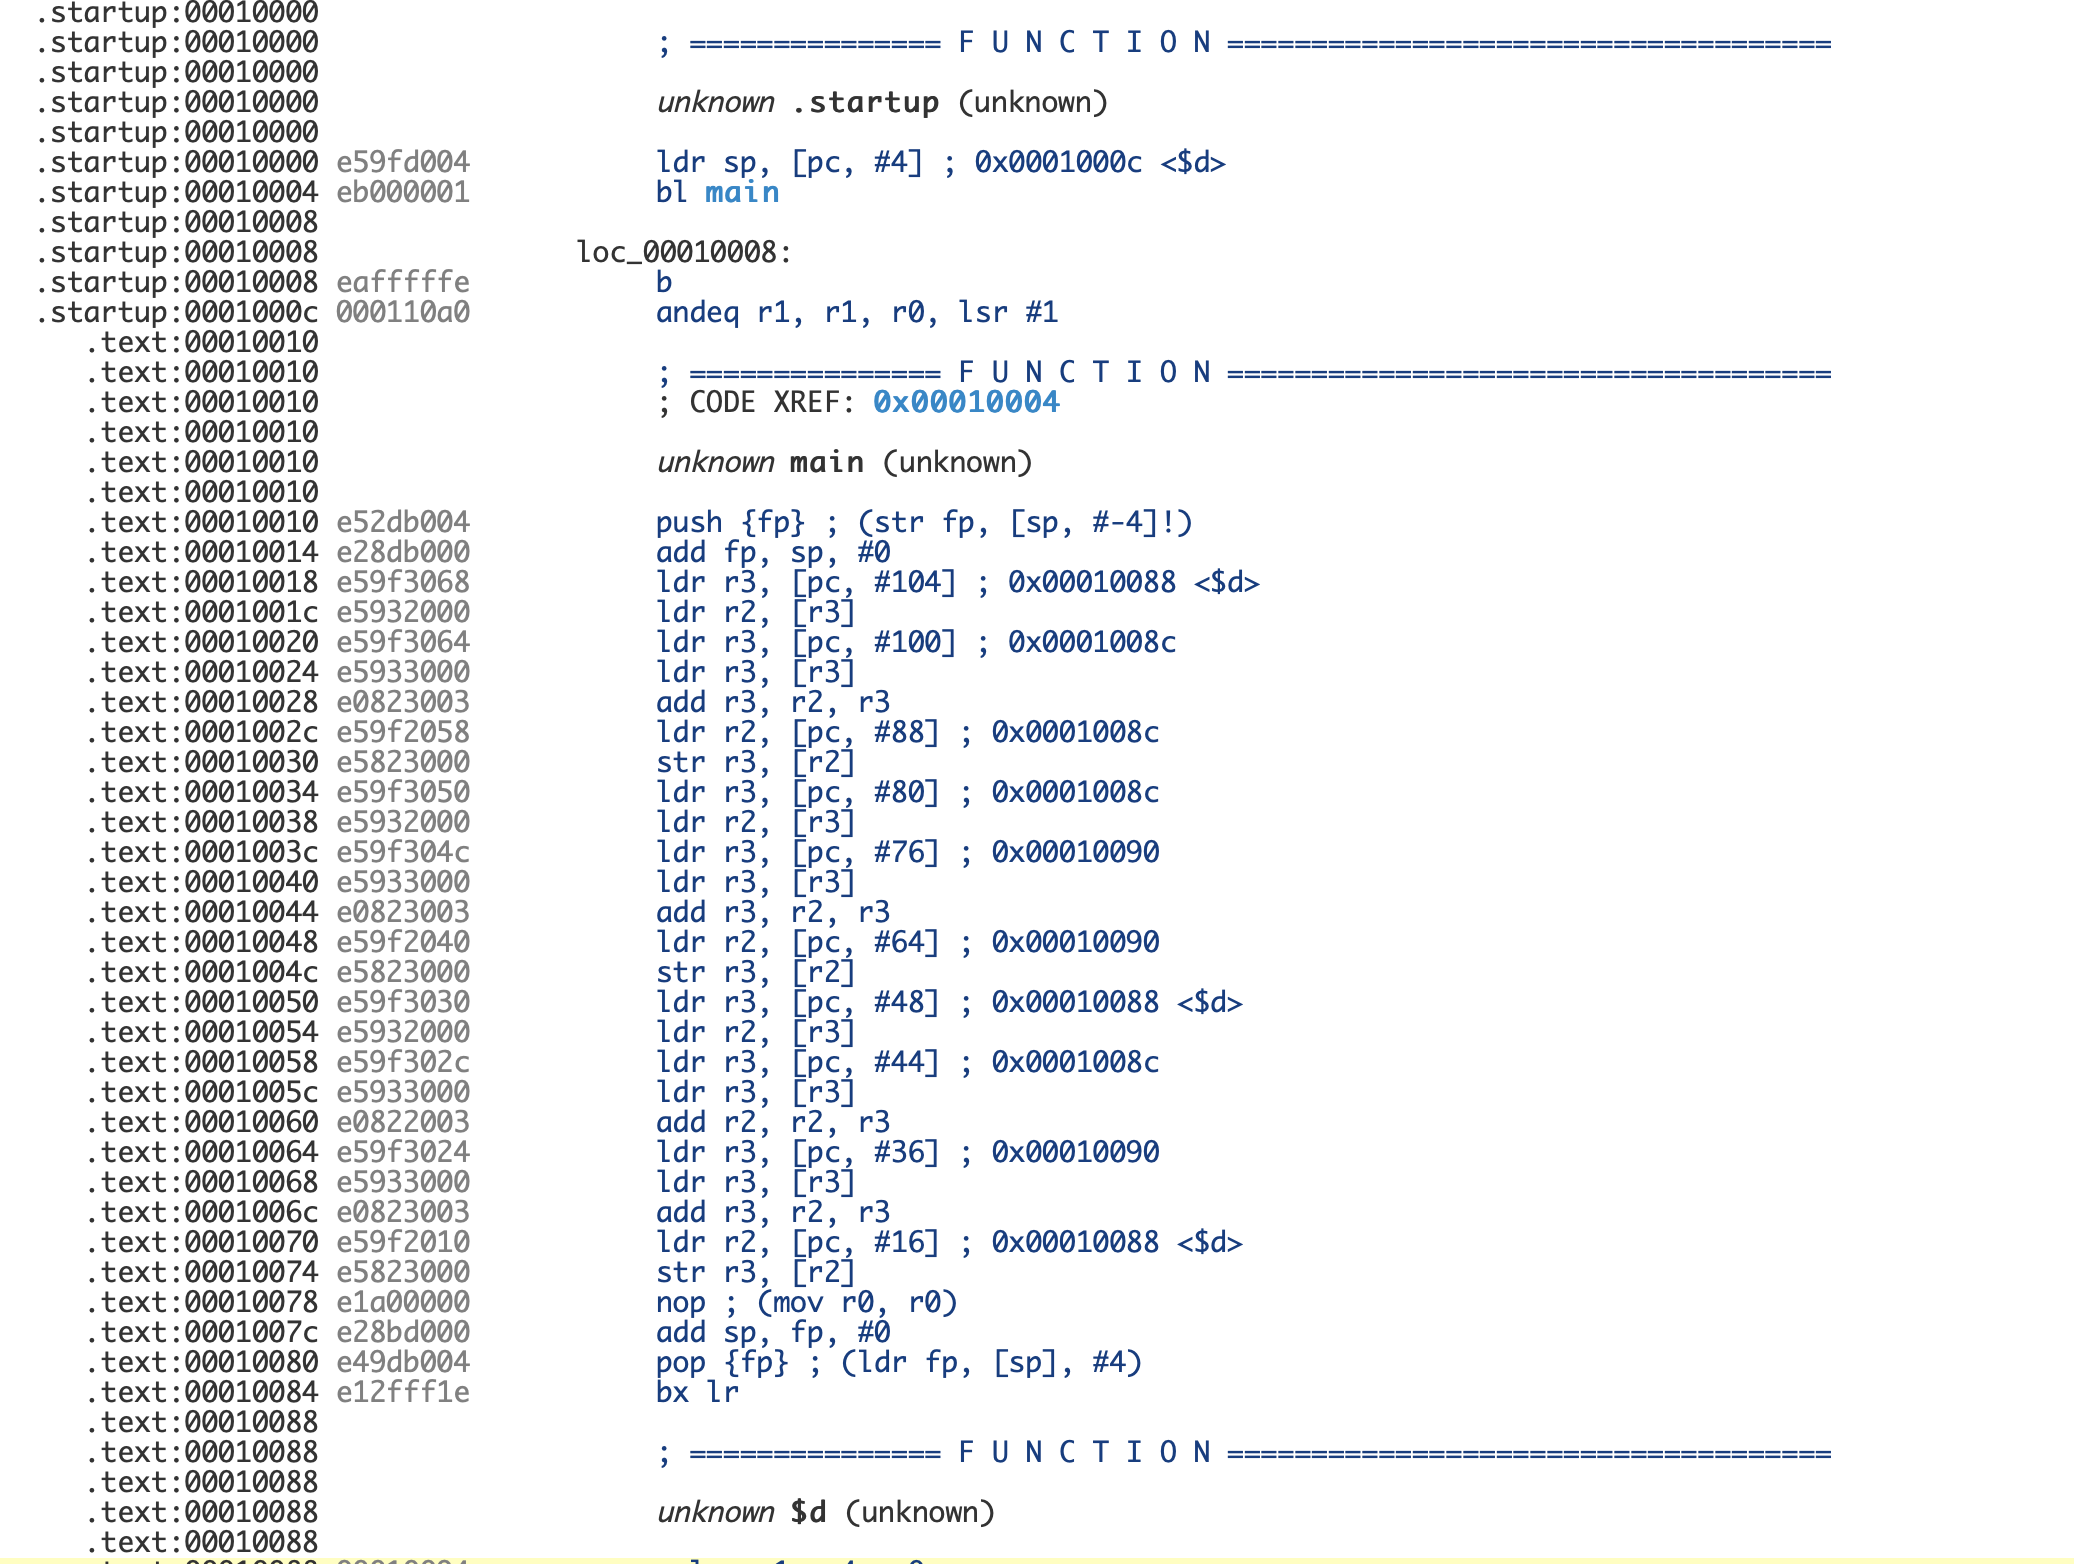
Next, within gdb set a break point at the code you wanted to investigate. It seems like you want gdb to stop at the instruction at 0x00010088 so use the following gdb command (note the asterix at the start of the address)
(gdb) break *0x00010088
Finally start the guest by issuing the "c" / "continue" command in gdb.
(gdb) c
The guest should run until just before it's about to execute the instruction at the specified address. Issue the gdb command "stepi" to execute the next assembly instruction and then either look at the registers in the "registers" window of your layout or issue the gdb command "info registers" to see the value of all the registers. Alternately you can view just one register with "print $<reg-name"
(gdb) info registers
r0 0x50000040 1342177344
r1 0x0 0
r2 0x201200c8 538050760
r3 0x0 0
r4 0x2000000 33554432
r5 0xff000000 -16777216
......
(gdb) print /x $lr
$8 = 0x000021c4
If you like you can have gdb display a particular value for each "stepi" you issue with the command
(gdb) display /x $lr
I hope all of this is of help. I'm not sure it completely aligns with what you're trying to achieve. If not then please let everyone know.
Good luck!
Berto.
On Fri, 15 Jan 2021, at 04:23, Naomi Motwani wrote:
Hello!
I am running a simple addition code on Arm A9 with three variables allotted to the heap. I need to track the memory locations from where the code is loading and storing to. I have hereby added the c code and the assembly version of the same. I need to trace the register contents after each instruction in the assembly code. I tried to print things in cpu-exec.c (in function cpu_tb_exec), but it only prints the register contents at the end of the Translation Buffer and not at the end of each load and store. Can someone please suggest a place where i can monitor the load store register contents in the source code every time this instruction is executed?
- Naomi
Attachments:
- test.c
- Screenshot 2021-01-07 at 10.08.21 AM.png
- Screenshot 2021-01-07 at 10.08.31 AM.png

