сре, 6. мај 2020. у 13:26 Alex Bennée <address@hidden> је написао/ла:
>
>
> Aleksandar Markovic <address@hidden> writes:
>
> Some preliminary thoughts....
>
Alex, many thanks for all your thoughts and hints that are truly helpful!
I will most likely respond to all of them in some future mail, but for now
I will comment just one.
> >>
> >> I just want to share with you some bits and pieces of data that I got
> >> while doing some preliminary experimentation for the GSoC project "TCG
> >> Continuous Benchmarking", that Ahmed Karaman, a student of the fourth final
> >> year of Electical Engineering Faculty in Cairo, will execute.
> >>
> >> *User Mode*
> >>
> >> * As expected, for any program dealing with any substantional
> >> floating-point calculation, softfloat library will be the the heaviest CPU
> >> cycles consumer.
> >> * We plan to examine the performance behaviour of non-FP programs
> >> (integer arithmetic), or even non-numeric programs (sorting strings, for
> >> example).
>
> Emilio was the last person to do extensive bench-marking on TCG and he
> used a mild fork of the venerable nbench:
>
> https://github.com/cota/dbt-bench
>
> as the hot code is fairly small it offers a good way of testing quality
> of the output. Larger programs will differ as they can involve more code
> generation.
>
> >>
> >> *System Mode*
> >>
> >> * I did profiling of booting several machines using a tool called
> >> callgrind (a part of valgrind). The tool offers pletora of information,
> >> however it looks it is little confused by usage of coroutines, and that
> >> makes some of its reports look very illogical, or plain ugly.
>
> Doesn't running through valgrind inherently serialise execution anyway?
> If you are looking for latency caused by locks we have support for the
> QEMU sync profiler built into the code. See "help sync-profile" on the HMP.
>
> >> Still, it
> >> seems valid data can be extracted from it. Without going into details, here
> >> is what it says for one machine (bear in mind that results may vary to a
> >> great extent between machines):
>
> You can also use perf to use sampling to find hot points in the code.
> One of last years GSoC student wrote some patches that included the
> ability to dump a jit info file for perf to consume. We never got it
> merged in the end but it might be worth having a go at pulling the
> relevant bits out from:
>
> Subject: [PATCH v9 00/13] TCG code quality tracking and perf integration
> Date: Mon, 7 Oct 2019 16:28:26 +0100
> Message-Id: <address@hidden>
>
> >> ** The booting involved six threads, one for display handling, one
> >> for emulations, and four more. The last four did almost nothing during
> >> boot, just almost entire time siting idle, waiting for something. As far as
> >> "Total Instruction Fetch Count" (this is the main measure used in
> >> callgrind), they were distributed in proportion 1:3 between display thread
> >> and emulation thread (the rest of threads were negligible) (but,
> >> interestingly enough, for another machine that proportion was 1:20).
> >> ** The display thread is dominated by vga_update_display() function
> >> (21.5% "self" time, and 51.6% "self + callees" time, called almost 40000
> >> times). Other functions worth mentioning are
> >> cpu_physical_memory_snapshot_get_dirty() and
> >> memory_region_snapshot_get_dirty(), which are very small functions, but are
> >> both invoked over 26 000 000 times, and contribute with over 20% of display
> >> thread instruction fetch count together.
>
> The memory region tracking code will end up forcing the slow path for a
> lot of memory accesses to video memory via softmmu. You may want to
> measure if there is a difference using one of the virtio based graphics
> displays.
>
> >> ** Focusing now on emulation thread, "Total Instruction Fetch Counts"
> >> were roughly distributed this way:
> >> - 15.7% is execution of GIT-ed code from translation block
> >> buffer
> >> - 39.9% is execution of helpers
> >> - 44.4% is code translation stage, including some coroutine
> >> activities
> >> Top two among helpers:
> >> - helper_le_stl_memory()
>
> I assume that is the MMU slow-path being called from the generated code.
>
> >> - helper_lookup_tb_ptr() (this one is invoked whopping 36 000
> >> 000 times)
>
> This is an optimisation to avoid exiting the run-loop to find the next
> block. From memory I think the two main cases you'll see are:
>
> - computed jumps (i.e. target not known at JIT time)
> - jumps outside of the current page
>
> >> Single largest instruction consumer of code translation:
> >> - liveness_pass_1(), that constitutes 21.5% of the entire
> >> "emulation thread" consumption, or, in other way, almost half of code
> >> translation stage (that sits at 44.4%)
>
> This is very much driven by how much code generation vs running you see.
> In most of my personal benchmarks I never really notice code generation
> because I give my machines large amounts of RAM so code tends to stay
> resident so not need to be re-translated. When the optimiser shows up
> it's usually accompanied by high TB flush and invalidate counts in "info
> jit" because we are doing more translation that we usually do.
>
Yes, I think the machine was setup with only 128MB RAM.
That would be an interesting experiment for Ahmed actually - to
measure impact of given RAM memory to performance.
But it looks that at least for machines with small RAM, translation
phase will take significant percentage.
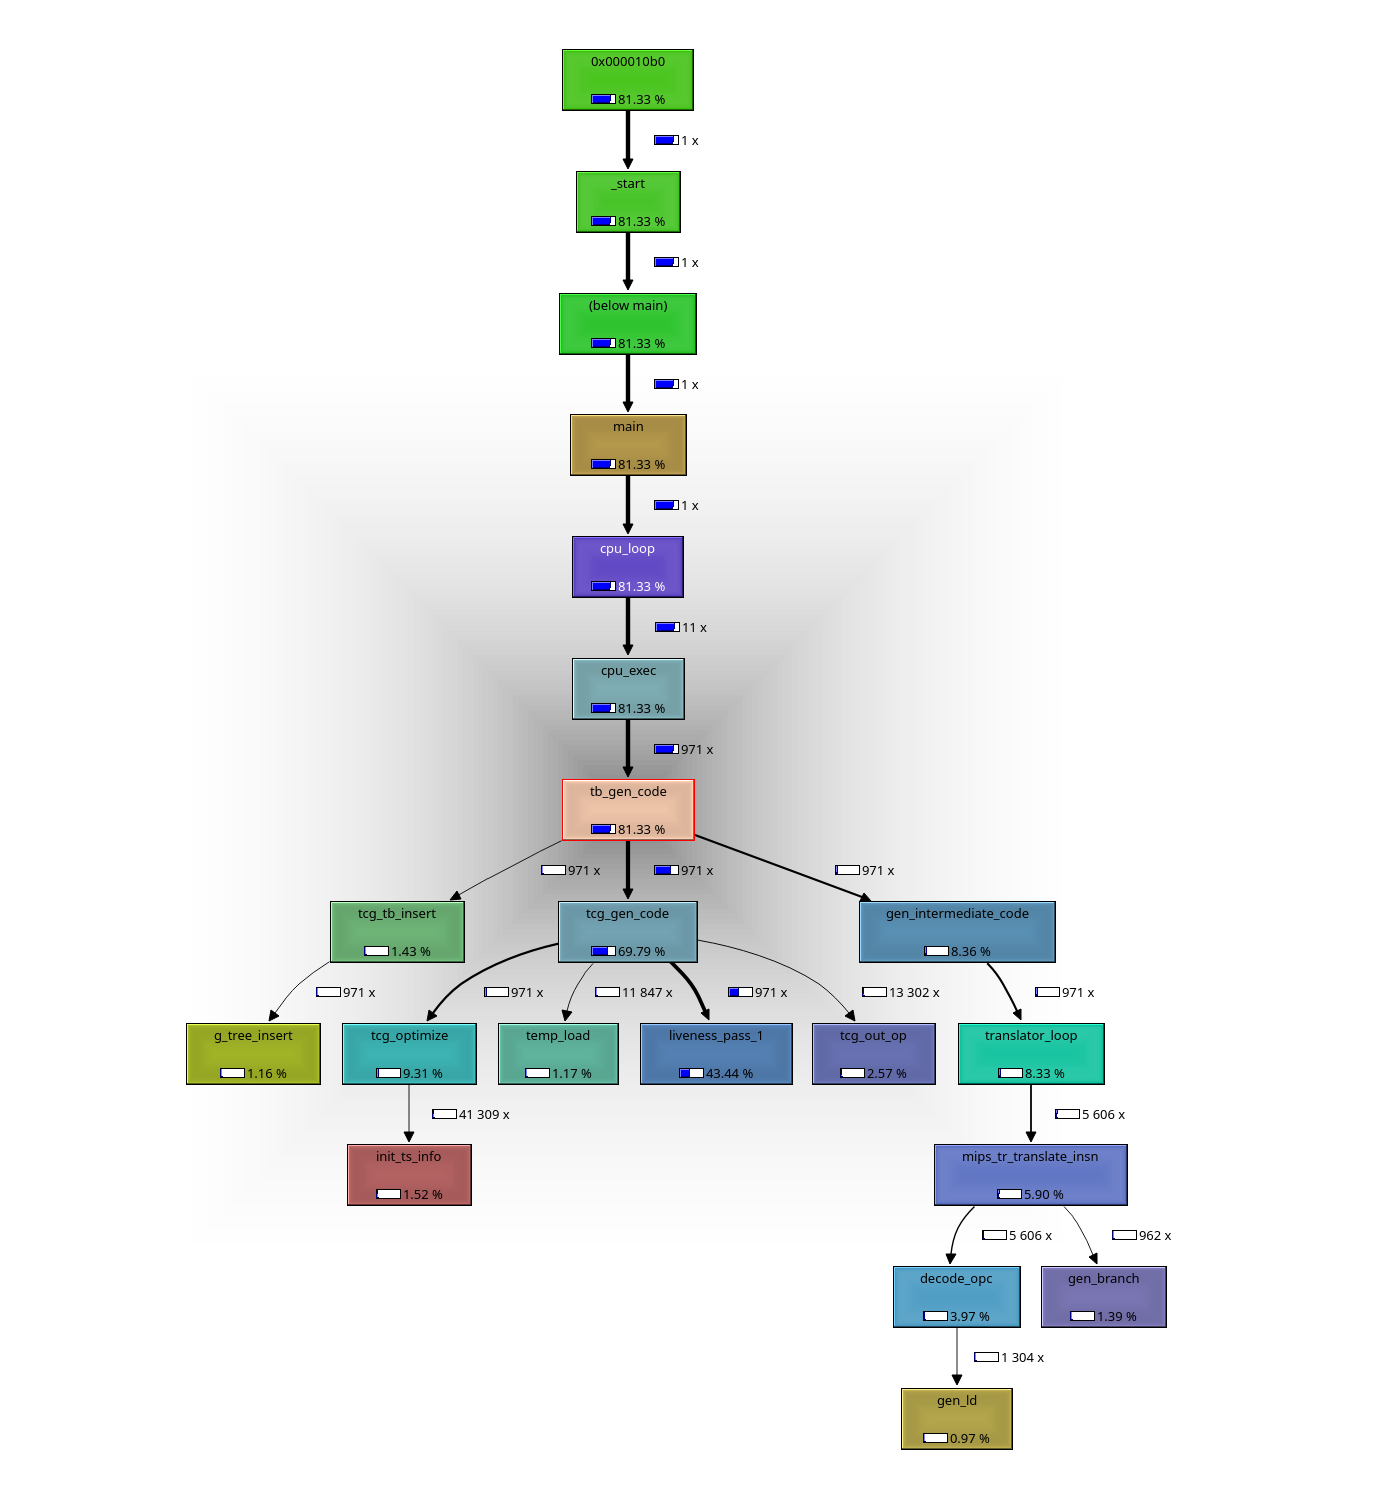
I am attaching call graph for translation phase for "Hello World" built
for mips, and emulated by QEMU: *tb_gen_code() and its calees)
(I am also attaching the pic in case it is not visible well inline)
> I'll also mention my foray into tracking down the performance regression
> of DOSBox Doom:
>
> https://diasp.eu/posts/8659062
>
> it presented a very nice demonstration of the increasing complexity (and
> run time) of the optimiser which was completely wasted due to
> self-modifying code causing us to regenerate code all the time.
>
> >>
> >> Please take all this with a little grain of salt, since these results are
> >> just of preliminary nature.
> >>
> >> I would like to use this opportunity to welcome Ahmed Karaman, a talented
> >> young man from Egypt, into QEMU development community, that'll work on "TCG
> >> Continuous Benchmarking" project this summer. Please do help them in his
> >> first steps as our colleague. Best luck to Ahmed!
>
> Welcome to the QEMU community Ahmed. Feel free to CC me on TCG
> performance related patches. I like to see things go faster ;-)
>
> --
> Alex Bennée