Description: PNG image
|
| From: | 赵鸿丰 |
| Subject: | [igraph] limitation of plotting area |
| Date: | Tue, 24 Feb 2015 15:16:13 +0800 |
Dear Sir/Madam:
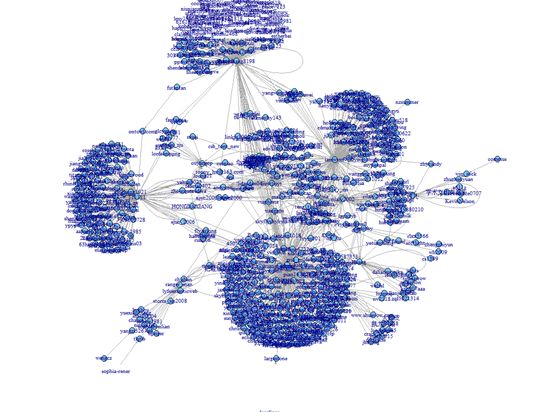
Thanks for your tips, with your help I can finally draw a much clearly social network graph from a document. I found that change xlim and ylim can make graph to fit the plotting space in RStudio or R console after several tests. However, there is an limitation on the size of these 2 plotting space. I use same code to draw graph the one output in R console is not present whole enough by cutting borders.
Here is my testing code:
#load the data of directed waighted social network
snet<-read.csv("E://exp//RoA.csv", header = TRUE, )
#drawing the graph of social network
library(igraph)
#prepare data in the form of data frame
relations<-data.frame(from=snet[,1],to=snet[,2], directed=TRUE)
#build the graph data frame
conv<- graph.data.frame(relations, directed=TRUE)
#plotting
plot(conv, layout=layout.fruchterman.reingold, xlim=c(-0.7,0.7), ylim=c(-0.7,0.7), vertex.size=3, edge.arrow.size=0.1, vertex.label.cex=0.7)
The plot in RStudio is just as below, it can not be save after zooming and accompany 4 warnings, though I copy it here as an expedient:
Warning messages:
1: In res[ord[idx]] <- r :
number of items to replace is not a multiple of replacement length
2: In res[ord[idx]] <- r :
number of items to replace is not a multiple of replacement length
3: In res[ord[idx]] <- r :
number of items to replace is not a multiple of replacement length
4: In res[ord[idx]] <- r :
number of items to replace is not a multiple of replacement length
(graph is in the attachment)
Notice the top border, we can see only lables left, many vertexes has lost. In fact, the situation of the bottom is the same, the vertex in the left corner could not display either.
I have seen several large SN graphs in the thesis, website or other media. I wonder if you could give me some advice on how to draw large graphs by igraph break the size limitation of R console and RStudio. I would be most grateful if you could reply at your earliest convenience. Looking forward to hearing from you. Thank you very much.
Sincerely yours
Humphrey Zhao
![]() 4igraph1477.png
4igraph1477.png
Description: PNG image
| [Prev in Thread] | Current Thread | [Next in Thread] |