Ø
I’m trying to make a 3D graph of y=1+x^3, highlighting the
area under the function curve where x is between 1 and 2.
Is this possible?
This is a pretty interesting question. I can reproduce the surface from the example but I think what you are interested in is effectively a bifurcated surface.
I can imagine making “cliff sides” to the surface:
x=[-5 -4 -3 -2 -1 0 1 2 2.99 3 4 4.01 5];
y=1.+x.^3
z=[-2.01 -2 -1 0 1 2 2.01]
x=x(:)
y=y(:)
z=repmat(z,size(x))
x=repmat(x,[1,7])
y=repmat(y,[1,7]);
y(10:11,1)=0
surf(x,z,y)
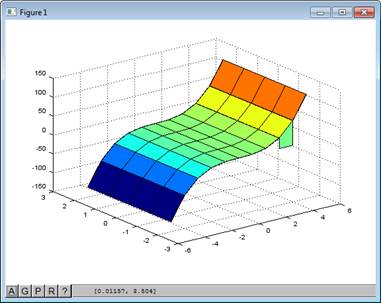
But where I struggle is to add the vertical sides, like this:
![]()

![]()
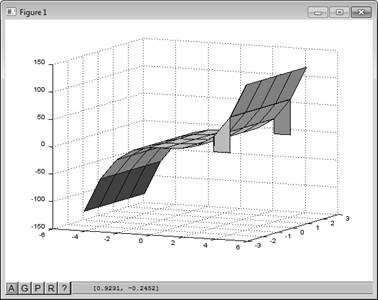
..since this looks like a bifurcated (branched) surface and I don’t think surf handles that. Although maybe it just needs a bit more imagination and the same
sort of non-linear spacing of data in the other directions, too?
Right, tea break’s over. Back on your heads.
Damian