Hello community,
I was wondering if there would be any way to plot lines with tranasèarency, or to set an alpha channel in the color spec for a plot. Or at least plans to implement it in the future.
a MWE
figure()
t=linspace(0,2*pi,10000);
hold on
p1=plot(t,sin(t)+0.25*randn(size(t)));
p2=plot(t,sin(t+pi/2)+0.25*randn(size(t)));
p3=plot(t,sin(t-pi/2)+0.25*randn(size(t)));
p4=plot(t,sin(t+pi)+0.25*randn(size(t)));
hold off
I would like to have the plot lines with some sort of translucency. In Matlab, I can then put
p1.Color(4)=0.05
to set the alpha channel to 5%
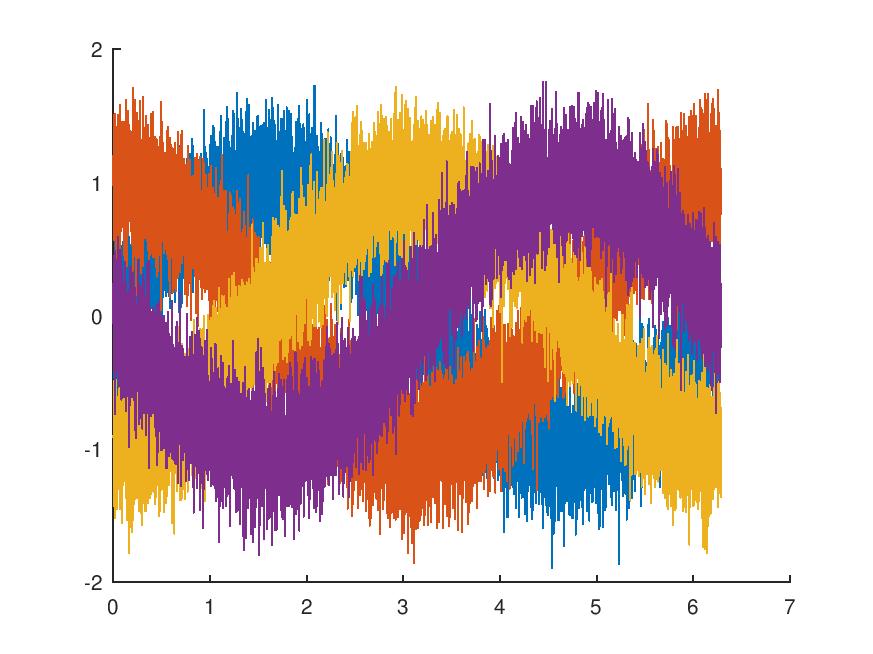
Octave result
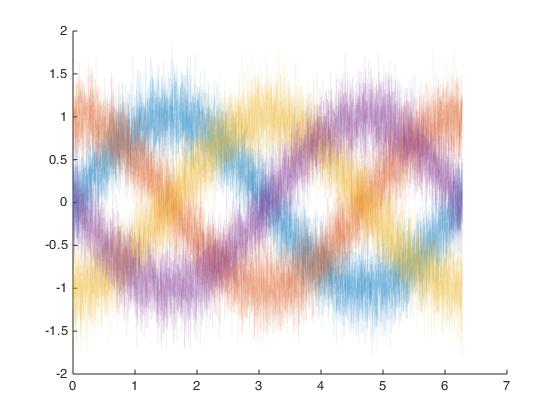
Matlab result (with 5% transparency for p1...p4)
I just want to plot high frequency signals, and present the noise as a shadow of the filtered signal.
Thanks