[Date Prev][Date Next][Thread Prev][Thread Next][Date Index][Thread Index]
Plotting an ELU function with GNU Octave
|
From: |
Alexandru Munteanu |
|
Subject: |
Plotting an ELU function with GNU Octave |
|
Date: |
Thu, 04 Feb 2021 20:34:31 +0200 |
|
User-agent: |
Evolution 3.36.4-0ubuntu1 |
Hello,
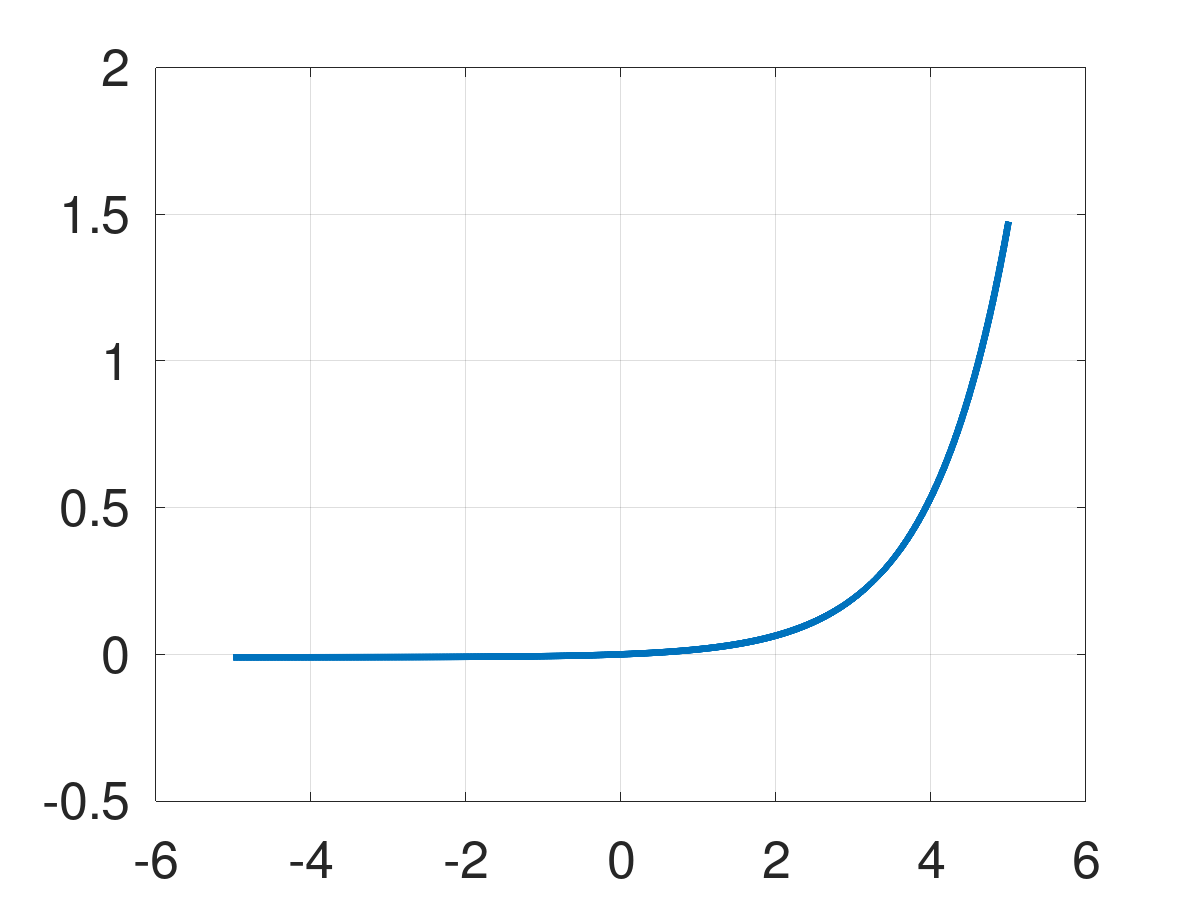
I am trying to create plots for an ELU (Exponential Liniear Unit)
funciton. The function is defined as follows:
function e = elu(z, alpha)
if z >= 0
e = z
else
e = alpha * ((exp(z)) - 1)
endif
endfunction
So this is pretty simple so far (alpha is a constant of values 0.01),
and I can test to evaluate it in the interpreter and everything is
working as expected.
However, I want to plot the values of elu(x), where x belongs to the
interval (-5, 5).
function plot_elu
x = -5:0.01:5
y = elu(x, 0.01)
plot(x, y, "linewidth", 5)
set(gca,"fontsize", 25)
axis([-6, 6, -1.2, 1.2])
grid on;
endfunction
This is where the plot goes wrong: it creates the plot as if the values
for elu are all going on the second branch of the if-then-else
statement.
I have attached what the plot looks like. Any help in this direction is
appreciated.
--
Alexandru Munteanu
 elu.png
Description: PNG image
 signature.asc
Description: This is a digitally signed message part
- Plotting an ELU function with GNU Octave,
Alexandru Munteanu <=