On Mon, Sep 17, 2018 at 9:24 AM Tso-Min Chou <address@hidden> wrote:
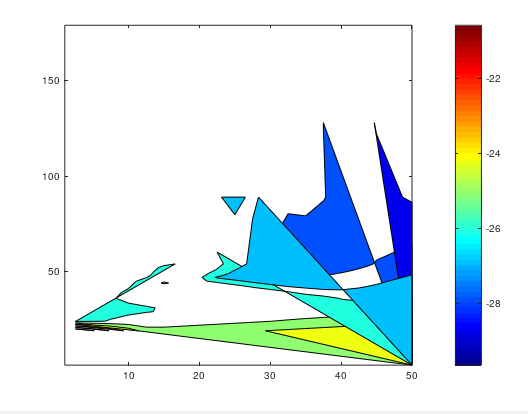
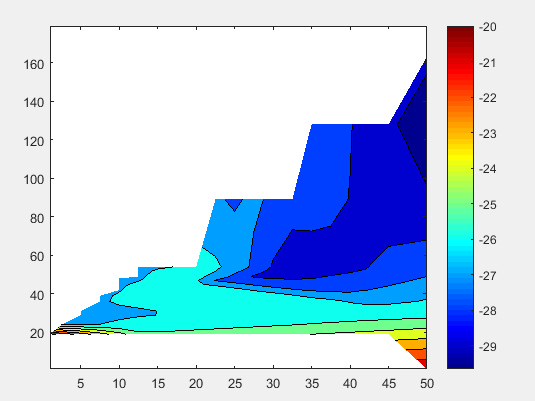
Hi,I did the 2D filled contour plot with both Octave and Matlab with same script file; but the filled contour plots are very different. I also checked the data file and they are the same.The following plot is from OctaveThis one is from MatlabAnd here is my script file run in both Octave and Matlab.data = "" ; % read filex = data(:,1);y = data(:,2);z = data(:,3);% Grid%x0 = min(x) ; x1 = max(x) ;%y0 = min(y) ; y1 = max(y) ;%N = 10 ;%x2 = linspace(x0,x1,N) ;%y2 = linspace(y0,y1,N) ;%[X,Y] = meshgrid(x2,y2) ;[X,Y] = meshgrid(sort(x),sort(y));Z = griddata(x,y,z,X,Y,'linear');figure (1)contourf(X,Y,Z);colormap ('jet')colorbarfigure (2)meshc(X,Y,Z)colormap ('jet')colorbarfigure (3)contour(X,Y,Z);%meshc(X,Y,Z)colormap ('jet')colorbarxlabel ('Vds')ylabel ('Ids(mA/mm)')title ('S11 VAEerr')Anyone can tell me what is the reason for the difference and how to solve it?Thanks,TM
What version of Octave are you using?
What OS?
Any packages installed?