Hi,
I did the 2D filled contour plot with both Octave and Matlab with same script file; but the filled contour plots are very different. I also checked the data file and they are the same.
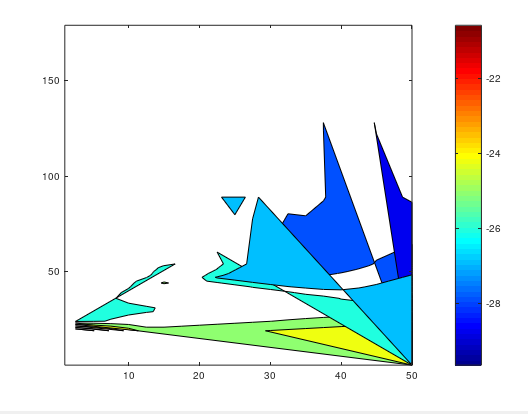
The following plot is from Octave
This one is from Matlab

And here is my script file run in both Octave and Matlab.
data = "" ; % read file
x = data(:,1);
y = data(:,2);
z = data(:,3);
% Grid
%x0 = min(x) ; x1 = max(x) ;
%y0 = min(y) ; y1 = max(y) ;
%N = 10 ;
%x2 = linspace(x0,x1,N) ;
%y2 = linspace(y0,y1,N) ;
%[X,Y] = meshgrid(x2,y2) ;
[X,Y] = meshgrid(sort(x),sort(y));
Z = griddata(x,y,z,X,Y,'linear');
figure (1)
contourf(X,Y,Z);
colormap ('jet')
colorbar
figure (2)
meshc(X,Y,Z)
colormap ('jet')
colorbar
figure (3)
contour(X,Y,Z);
%meshc(X,Y,Z)
colormap ('jet')
colorbar
xlabel ('Vds')
ylabel ('Ids(mA/mm)')
title ('S11 VAEerr')
Anyone can tell me what is the reason for the difference and how to solve it?
Thanks,
TM