help-octave
[
Top
][
All Lists
]
Advanced
[
Date Prev
][
Date Next
][
Thread Prev
][
Thread Next
][
Date Index
][
Thread Index
]
patch with "Edges have no color"
From
:
Andre Valente
Subject
:
patch with "Edges have no color"
Date
:
Wed, 23 Oct 2013 11:31:42 +0100
Hi all,
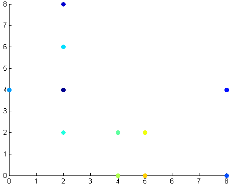
I want to plot a figure like the one in attachment. I can't seem to do it in octave. Using matlab I use patch:
x=[1 2 3]
y=[1 2 3]
z=[0.1 0.2 0.3]
figure
p=patch(x,y,z,'MarkerSize',25,'Marker','o','MarkerFaceColor','flat','FaceColor','none');
set(p,'EdgeColor','none')
caxis([0 0.5]);
Can anyone help me? Thanks!
Cheers,
Andre
patch.png
Description:
PNG image
reply via email to
[Prev in Thread]
Current Thread
[Next in Thread]
patch with "Edges have no color"
,
Andre Valente
<=
Prev by Date:
Shush!
Next by Date:
Re: Shush!
Previous by thread:
Shush!
Next by thread:
octave development version from source
Index(es):
Date
Thread