[Date Prev][Date Next][Thread Prev][Thread Next][Date Index][Thread Index]
plot() not behaving how I expect
|
From: |
Galen O'Neil |
|
Subject: |
plot() not behaving how I expect |
|
Date: |
23 Oct 2002 01:11:03 -0700 |
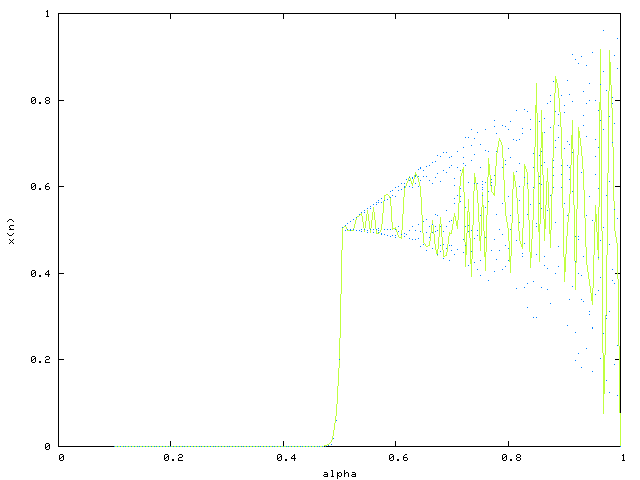
I'm trying to create a bifurcation diagram, which is a scatter plot of
many points.  For every value on the x-axis (alpha) I have 31 values on
the y-axis (x) to plot.  They are stored it 2 matrices, and I attempted
to plot the entire thing with one command.  Here is the text from my
session:

octave:17> gset term png
octave:18> gset output "alphavx.png"
octave:19> size(x)
ans =
  181   31
octave:20> size(alpha)
ans =
    1  181
octave:21> plot(alpha,x,".b")

I would expect the plot to be a bunch of blue points, arranged in some
order, where there are generally many points for a given values on the
x-axis.  This isn't what I get.  I get many points, with one single line
through them, this line isn't even blue.  I don't understand what
setting is causing that line.  My primary concern is to get rid of this
line.  I am suspicious that not all of the points are being plotted (31
per x-axis value) but the line is much more bothersome.  I've attached a
copy of the resulting graph, however I'm new to this list and not sure
if it will get through.  If it doesn't get through, feel free to ask me
for the picture via direct email.
Thank you,
Galen
 alphavx.png
Description: PNG image
| [Prev in Thread] |
Current Thread |
[Next in Thread] |
- plot() not behaving how I expect,
Galen O'Neil <=