Hi Berto Furth,
Thank you for the kind explanation.
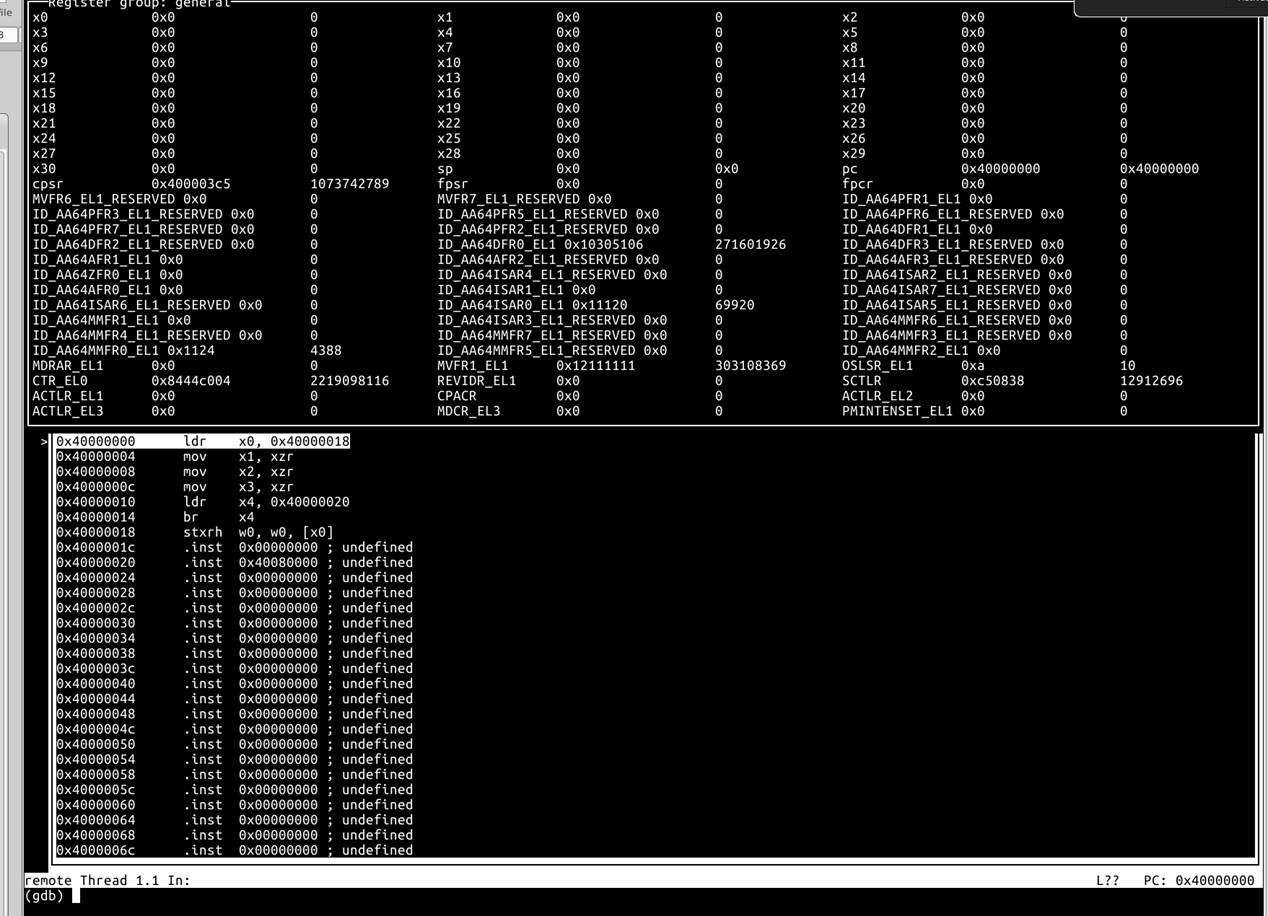
I tried your suggestion and could see the stepi working correctly with an existing linux boot case.
(actually I tried similar thing before but couldn’t see the code stepping at that time. I find the “layout reg” command is good.
At that time, I could set break point (it appeared so) but when I press ‘c’ it just ran to the end. (it was a linux booting)
I tried with linux tiny-config build but it didn’t boot, but I can see the code stepping through the assembly code at the beginning at least.
By any chance, can you identify where this first code below comes from the linux source? (or anyone else?) Maybe something wrong with tyny-config I tried.
It’s different from arch/arm64/kernel/head.S, and I’ll try to figure this out sooner (I’m trying to run a simple bare-metal program on qemu now).

Thank you very much!
Chan Kim
From: Berto Furth <bertofurth@sent.com>
Sent: Tuesday, February 9, 2021 1:40 PM
To: ckim <ckim@etri.re.kr>; nerijus--- via <qemu-discuss@nongnu.org>
Subject: Re: how to track cpu's instruction access in qemu?
I'm afraid I don't know the precise answer to your question but have you considered using gdb to remotely debug the guest in QEMU to accomplish this? With gdb running remotely you can step though assembly instructions being executed by the guest one at a time and keep tabs on registers and so forth.
Here's a slightly edited cut and paste from another time I posted about this. Note that where I mention "qemu-system-arm" you can subsitute your own gemu exeuctable.
To prepare QEMU to allow guest debugging with gdb add something like "-gdb tcp::1234" as well as "-S" to the end of your "qemu-system-arm" command then run as normal. You may also need to include the "-singlestep" option.
The "-gdb tcp:12345" parameter allows gdb on the same machine (or a remote machine) to connect to the gdbserver within QEMU on tcp port "12345" (you can change this number) and debug what's happening on the guest. The "-S" (that's a capital S) tells QEMU to not start the guest until gdb is connected and you've issued the "c" / "continue" command in gdb monitor. The "-singlestep" option may be necessary while debugging so that tcg doesn't do any optimization that causes instructions to be skipped.
So after starting QEMU in one window, in another window start up gdb with
gdb -ex "target remote 127.0.0.1:12345"
Change 127.0.0.1 to the IP of the host running qemu if gdb is running on a different system.
Make sure your version of gdb supports whatever architecture your guest is running. If it doesn't you might get an error when starting up gdb. You might need to use "gdb-multiarch" on some distros or find a version of gdb specific to your guest arch. on some others. For example, to check if your version of gdb supports "arm" architecture run "gdb" then in the interactive mode type "set architecture" then hit <tab> to see what architectures your version of gdb supports. Hopefully "arm" is in there.
(gdb) set architecture <tab>
Display all 200 possibilities? (y or n) y
A6 armv8-a crisv32 i386 m68k:548x m68k:isa-c:mac mips:9000
A7 armv8-m.base .....
MicroBlaze avr:101 csky:ck807 iq2000 m68k:cfv4e mips:14000 mips:isa32r6
arm avr:102 csky:ck810 iwmmxt m68k:cpu32 mips:16 mips:isa64
arm_any ....
At this point in gdb I would suggest setting the layout so that you can see the assembly code being executed as well as the current register values changing. This can be done with the gdb command "layout regs". This step is optional.
(gdb) layout regs
Next issue the command "stepi" to move forward by a single instruction. You should see the display move forward one instruction in the list of displayed assembly instructions.
If you want to set a break point at the code you wanted to investigate then you can command gdb to let the guest program run until it gets to a specified instruction. For example if you want gdb to stop at the instruction at 0x00010088 use the following gdb command (note the asterix at the start of the address)
(gdb) break *0x00010088
Finally start the guest by issuing the "c" / "continue" command in gdb.
(gdb) c
The guest should run until just before it's about to execute the instruction at the specified address. Issue the gdb command "stepi" to execute the next assembly instruction and then either look at the registers in the "registers" window of your layout or issue the gdb command "info registers" to see the value of all the registers. Alternately you can view just one register with "print $<reg-name"
(gdb) info registers
r0 0x50000040 1342177344
r1 0x0 0
r2 0x201200c8 538050760
r3 0x0 0
r4 0x2000000 33554432
r5 0xff000000 -16777216
......
(gdb) print /x $lr
$8 = 0x000021c4
If you like you can have gdb display a particular value for each "stepi" you issue with the command
(gdb) display /x $lr
I hope all of this is of help. I'm not sure it completely aligns with what you're trying to achieve. If not then please let everyone know.
If you want to find out more about gdb then I'm sure you're resourceful enough to find one of the dozens of tutorials on it.
Good luck!
On Tue, 9 Feb 2021, at 12:41, ckim@etri.re.kr wrote:
Hello,
If I want to see cpu’s instruction access (read virtual address and the read instruction data), where should I look in the qemu code?
I want to check if the cpu is following the executable I provided with –kernel option.
Can I use “—trace” option for this? If possible, just a simple instruction will be very much appreciated.
Thanks in advance.
Chan Kim
- image002.jpg