Dear R Community,
I’m relatively new user of R and igraph, so please excuse me if my question is naive. I found igraph very useful in my work however I experienced a problem with plotting the graph, which I cannot overcome.
I have an OTU Table (attached) which I used in Sparcc http://psbweb05.psb.ugent.be/conet/microbialnetworks/sparcc.php to compute P-values from bootstrapped correlations as instructed in Sparcc Tutorial.
Nextly, the computed p-values (pvals_two_sided.txt ,attached herewith this email) were used in igraph to convert it into matrix of significance and graph was plotted.The code I used :
library(igraph)
path="pvals_two_sided.txt"
pvals=read.table(path,header=TRUE,sep="\t")
pvals.mat=pvals[,2:ncol(pvals)]
# set p-values of 0 to a non-zero, small p-value so we can take the logarithm
pvals.mat[pvals.mat==0]=0.000000001
# convert into significance
sig.mat=-1*log10(pvals.mat)
# remove all edges with significance below 1
sig.mat[sig.mat<1]=0
sig.mat=as.matrix(sig.mat)
# convert adjacency matrix into a graph
sparcc.graph=graph.adjacency(sig.mat,mode="undirected")
# display the graph
layout=layout.spring
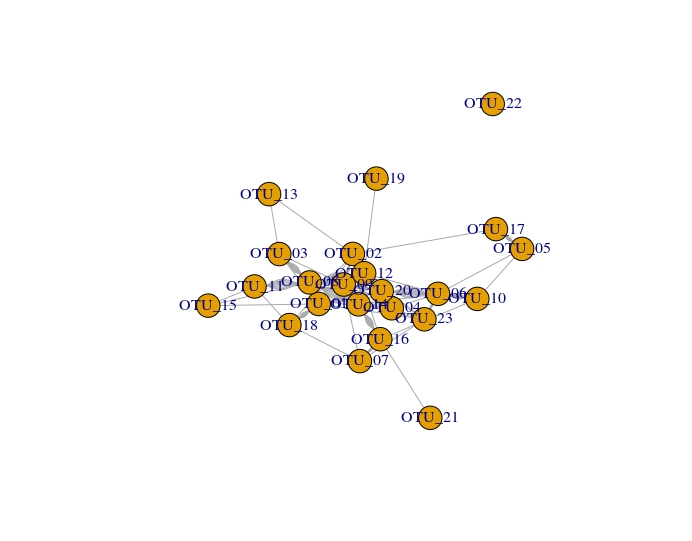
plot(sparcc.graph, layout=layout)
The graph generated is Network_igraph.jpeg.
The graph generated was converted to visualize in Cytoscape .graphml format using write.graph command but dual connections were observed between two nodes which are unwanted.The cytoscape version is shown below.
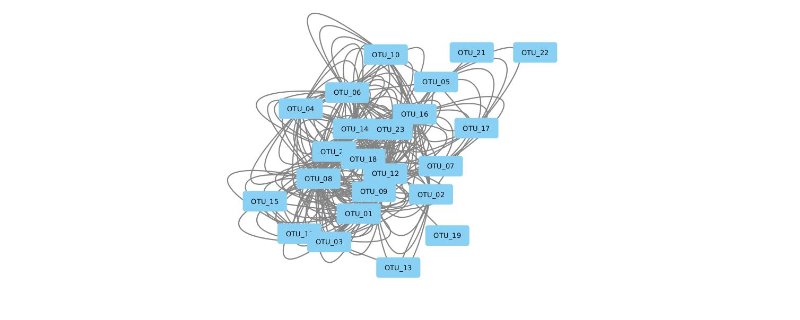
How can I remove the dual connectivity and generate a proper network for visualization.It would be highly appreciated if I am kindly instructed how should I deal with this problem.
Looking forward to hear from the community.
Thanks and Regards,
Sandipan