Here is a dirty solution using the netdiffuseR package. In particular, I use the function edges_coords which computes edges coordinates considering device size and vertices size in terms of the x axis... is not as flexible as igraph.plotting, but it solves your issue... Will work on a better solution for the future!
rm(list =ls())
library(netdiffuseR)
library(igraph)
nodes <- c('a','b','c','d','e','f')
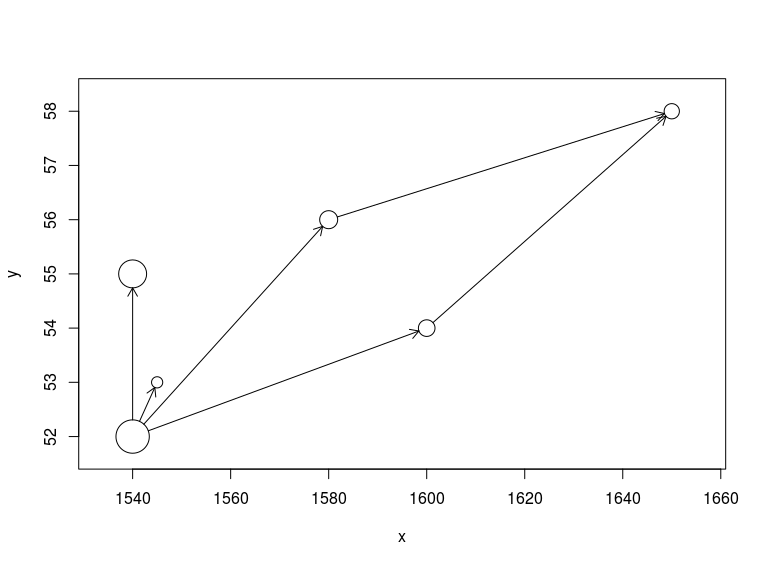
x <- c(1540, 1545, 1540,1580,1600,1650)
y <- c(52, 53, 55,56,54,58)
from <- c('a','a','a','a','e','d')
to <- c('b','c','d','e','f','f')
Nodelist <- data.frame(nodes, x ,y)
Edgelist <- data.frame(from, to)
a <- graph_from_data_frame(vertices = Nodelist, d= Edgelist, directed = TRUE)
# Getting edge coordinates
vcex <- runif(nnodes(as_adj(a)), 1, 4)
ecoords <- edges_coords(
as_adj(a),
rep(10L, nnodes(as_adj(a))),
x = x, y = y,
vertex_cex = vcex,
dev = par("pin"), no_contemporary = FALSE,
undirected = FALSE
)
ecoords <- as.data.frame(ecoords)
# Plotting
symbols(x, y, circles=vcex,
inches=FALSE, xaxs="i", yaxs="i")
with(ecoords, arrows(x0,y0,x1,y1, length=.1))