On Wed, Apr 21, 2010 at 6:50 AM, Vincent Gagnon <address@hidden> wrote:
Hello Gabor,
I've been reading through http://igraph.sourceforge.net/igraphbook/igraphbook-creating.html
If I am correct, I understand that this page explains how to prepare your data to go through iGraph software? Is that correct?
Our problem is that we cannot use iGraph, even if we believe it would be the perfect solution. We must use a unique programmation language using Java that was designed in Toronto to work with Knowledge Forum. http://www.knowledgeforum.com/ http://en.wikipedia.org/wiki/Knowledge_Forum
Knowledge Forum is a software designed for school purpose and it integrates Java Assessment Applets which are programmed with Java especially for KF.(Knowledge Forum) There are actually different applets, Contribution Tool, the Semantic Overlap Tool, the Vocabulary Growth Tool, the Writing Measures Tool and the Social Network Tool. (http://ikit.org/kf/46/help/enhanced/NetworkAnalysisTool.htm)
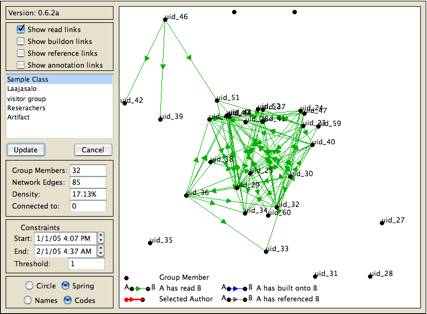
Actually, the social network tool is limited. If you look closely at the last link I inserted above, you'll see that the representation layout it generates are unclear. (I also included it below)
We presently have one programmer that is familiar with programming in Java, and he has access to the code of the program. We would like to help him introduce other algorithms that makes it possible to display social network with a pattern like iGraph can display. Layout like Fruchterman-Reingold, tkplot or Erdos-Rényi random graph are what we are aiming.
I also want to inform you that we are not business oriented, we are a group of searchers developing these tools for teachers who use Knowledge Forum and who expect to better understand the social network patterns developing between their students using this tool. I also want you to know that Knowledge Forum is expected to open its code to public. We believe in sharing work, and this projet is taking this next step in the near future.
I hope I have been clearer in explaining the context surrounding my request for some help,
Sincerely,Le 2010-04-20 15:59, Gábor Csárdi a écrit :
Vincent Gagnon
University of Quebec in Chicoutimi
Canada
Hi Vincent,

perhaps read http://igraph.sourceforge.net/igraphbook/igraphbook-creating.html
after reading an R tutorial. See the R homepage for tutorials.

Gabor

On Tue, Apr 20, 2010 at 9:43 PM, Vincent Gagnon <address@hidden> wrote:
Hi Gabor, I now understand what you meant by R and Python, those are two languages of programmation for SNA. Is that correct? I know I'm a newbie in SNA. I have looked at your attached links and I've seen that among all possible SNA representation, the way to generate coordinate are the followings: layout.random(graph, params, dim=2) layout.circle(graph, params) layout.sphere(graph, params) layout.fruchterman.reingold(graph, ..., dim=2, verbose=igraph.par("verbose"), params) layout.kamada.kawai(graph, ..., dim=2, verbose=igraph.par("verbose"), params) layout.spring(graph, ..., params) layout.reingold.tilford(graph, ..., params) layout.fruchterman.reingold.grid(graph, ..., verbose=igraph.par("verbose"), params) layout.lgl(graph, ..., params) layout.graphopt(graph, ..., verbose = igraph.par("verbose"), params = list()) layout.mds(graph, d=shortest.paths(graph), ...) layout.svd(graph, d=shortest.paths(graph), ...) layout.norm(layout, xmin = NULL, xmax = NULL, ymin = NULL, ymax = NULL, zmin = NULL, zmax = NULL) We are looking for a way to calculate the data positionning. We don't know how to proceed with calculation, but from your database information, I think it will be something like "layout.fruchterman.reingold" or another function. For you information, I've attached a picture of our actual SNA displays. We can generate circle representations and some random placing nodes. We would like to succeed in placing them in a Fruchterman Reingold display. Can you help us programming the algorithm? Or, how do we calculte nodes positionning? Thank you for your help, Vincent Gagnon University of Quebec in Chicoutimi Canada 2010/4/20 Gábor Csárdi <address@hidden>Hi Vincent, next time, please reply to the mailing list as well. Thanks. You have a long way to go to work with igraph if you do not know R or Python. Here is where to start: http://www.r-project.org http://www.python.org Gabor On Tue, Apr 20, 2010 at 9:04 PM, Vincent Gagnon <address@hidden> wrote:Hi Gabor, 2010/4/20 Gábor Csárdi <address@hidden>Hi Vicent, On Tue, Apr 20, 2010 at 8:44 PM, Vincent Gagnon <address@hidden> wrote:Hello igraph-help members, I am an assistant on a research project in Canada. We are trying to solve an issue with social network analysis. Our main concern is how to proceed to place dots in the matrix?what exactly do you mean by this? You need a way to smartly place the nodes for drawing the graph?Yes, I need to understand how to have a smart way to place nodes in the graph.You did not tell us whether you want toI don't know the difference between R and Pythin. Can you show me or explain me?use R or Python. In R this would be something like: pos <- layout.fruchterman.reingold(mygraph) plot(mygraph, layout=pos) Check the documentation for the various plot options at http://igraph.sourceforge.net/doc/R/layout.html or type help("layout.kamada.kawai") in your R session. See also the plotting parameters at http://igraph.sourceforge.net/doc/R/plot.common.html or type help("igraph.plotting") GaborThank you Gabor!How can we place all dots on our social network graph? If you can answer me in terms of programming, it would really help us. Presently, we only manage to place them in circle but we know it's not the best way to represent our social network. Thank you very much, Vincent Gagnon University of Quebec in Chicoutimi Canada http://igraph.sourceforge.net/screenshots.html _______________________________________________ igraph-help mailing list address@hidden http://lists.nongnu.org/mailman/listinfo/igraph-help-- Gabor Csardi <address@hidden> UNIL DGM-- Gabor Csardi <address@hidden> UNIL DGM
-- Vincent Gagnon Maitrise en éducation Université du Québec à Chicoutimi (418) 698-7134 Maison (418) 550-1881 Cellulaire
--
Gabor Csardi <address@hidden>     UNIL DGM
