|
| From: | przemek klosowski |
| Subject: | Re: problem with leasqr fitting |
| Date: | Fri, 19 Mar 2021 15:46:08 -0400 |
| User-agent: | Mozilla/5.0 (X11; Linux x86_64; rv:78.0) Gecko/20100101 Thunderbird/78.8.0 |
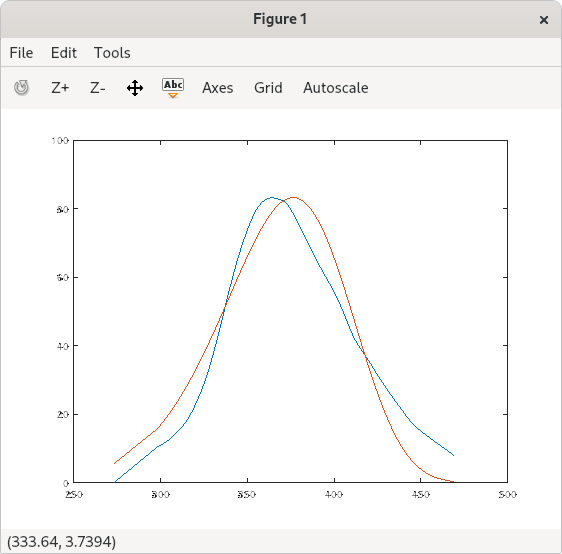
If you plot (temp,intensity,temp,f2) it does a so-so job of
fitting your data. Are you concerned about corp1 and covp1?
Your model does not seem to conform very well with the data, so probably the minimum is very shallow and parameters are poorly correlated.

NB, the code uses data-smoothing and signal packages, so they
need to be loaded to replicate.
Hello,

I am trying to perform a fitting and I am obtaining the following results
pfit1 =

   375.11773
    83.26345
     0.29860

kvg = 1
iter =  3
corp1 =

    NA    NA    NA
    NA    NA    NA
    NA    NA    NA

covp1 =

    NA    NA    NA
    NA    NA    NA
    NA    NA    NA

I attach the data for consideration

thanks

datam= xlsread ('data1.xlsx');

temp=datam(1:173,1)+273;
[intensity, lambda] = regdatasmooth (temp, datam(1:173,2));

k=8.6170e-005;

[pks, loc]=findpeaks (intensity,"DoubleSided");

imaxi=intensity(loc(index=find(pks==max(pks))));
tmaxi=temp(loc(index=find(pks==max(pks))));


eacti1= 0.2;

parTLi1 = [tmaxi,imaxi,eacti1];

F1=@(temp,parTLi1)(imaxi*exp(1+parTLi1(3)./(k*temp).*(temp-parTLi1(1))/parTLi1(1)-temp.^2/parTLi1(1).^2*(1-(2*k*parTLi1(1))/parTLi1(3)).*exp(parTLi1(3)./(k*temp).*(temp-parTLi1(1))/parTLi1(1))-(2*k*parTLi1(1)/parTLi1(3))));

wt_tl=ones(size(temp));
iter_tl=800;
tol_tl=0.1;
dFdp_tl="dfdp";
dp_tl=0.0001*ones(size(parTLi1));

%tolerance
tmax_max=tmaxi+2;
tmax_min=tmaxi-2;
imax_max=imaxi+100;
imax_min=imaxi-100;
eact_max=1.3;
eact_min=0.5;

bounds= [tmax_min,tmax_max; imax_min, imax_max; eact_min,eact_max];


f2=0;

[f2, pfit1, kvg, iter, corp1, covp1, covr1,r2] = leasqr (temp, intensity,
parTLi1, F1,tol_tl, iter_tl,wt_tl, dp_tl, dFdp_tl, bounds)

data1.xlsx <https://gcc02.safelinks.protection.outlook.com/?url="">


--
Sent from: https://gcc02.safelinks.protection.outlook.com/?url="">
| [Prev in Thread] | Current Thread | [Next in Thread] |