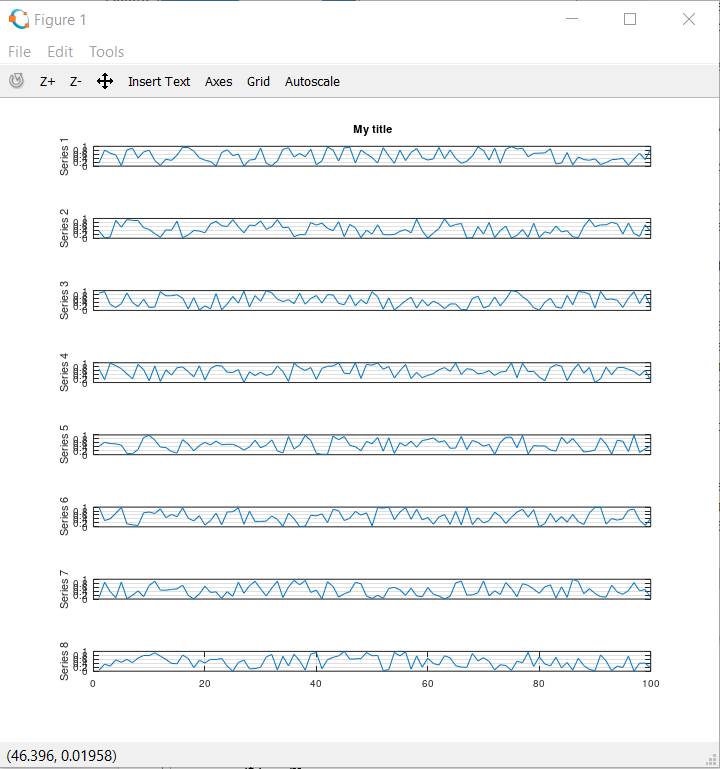
I would like to plot multiple subplots in a single figure. Because of the large number of graphs I want to suppress all labels from the horizontal axis, except the bottom one, and reduce the space between the graphs. According to the documentation the ‘position’ parameter in the subplot can be used to define location and size of each subplot.
When the script executes, in debug mode, the first ‘subplot’ command draws the expected layout for the first plot. However, when the subsequent ‘plot’ command is executed the size of the plot is reduced and the intended layout is ignored. Can someone please tell me how I can reduce the wasted space between plots?
I’m using Octave 5.2 on Windows 10
Thanks for any help.
m = 8;
d = rand(100,m);
rnge = 1:100;
figure (1)
for i = 1:m
x = 0.05;
y = 0.95 - i * 0.9/m;
width = 0.9;
height = 0.9/m;
subplot(m,1,i,'position',[x,y,width,height]);
plot(rnge,d(:,i))
if i == m
axis("tic","label")
else
axis("ticy","labely")
endif
grid,ylabel(sprintf('Series %d',i));
if i == 1
title('My title')
endif
endfor