Description: imageplot_narrow.png
|
| From: | Joe Tusek |
| Subject: | help - image representation not filling figure window |
| Date: | Tue, 5 Nov 2019 10:13:59 +0000 |
|
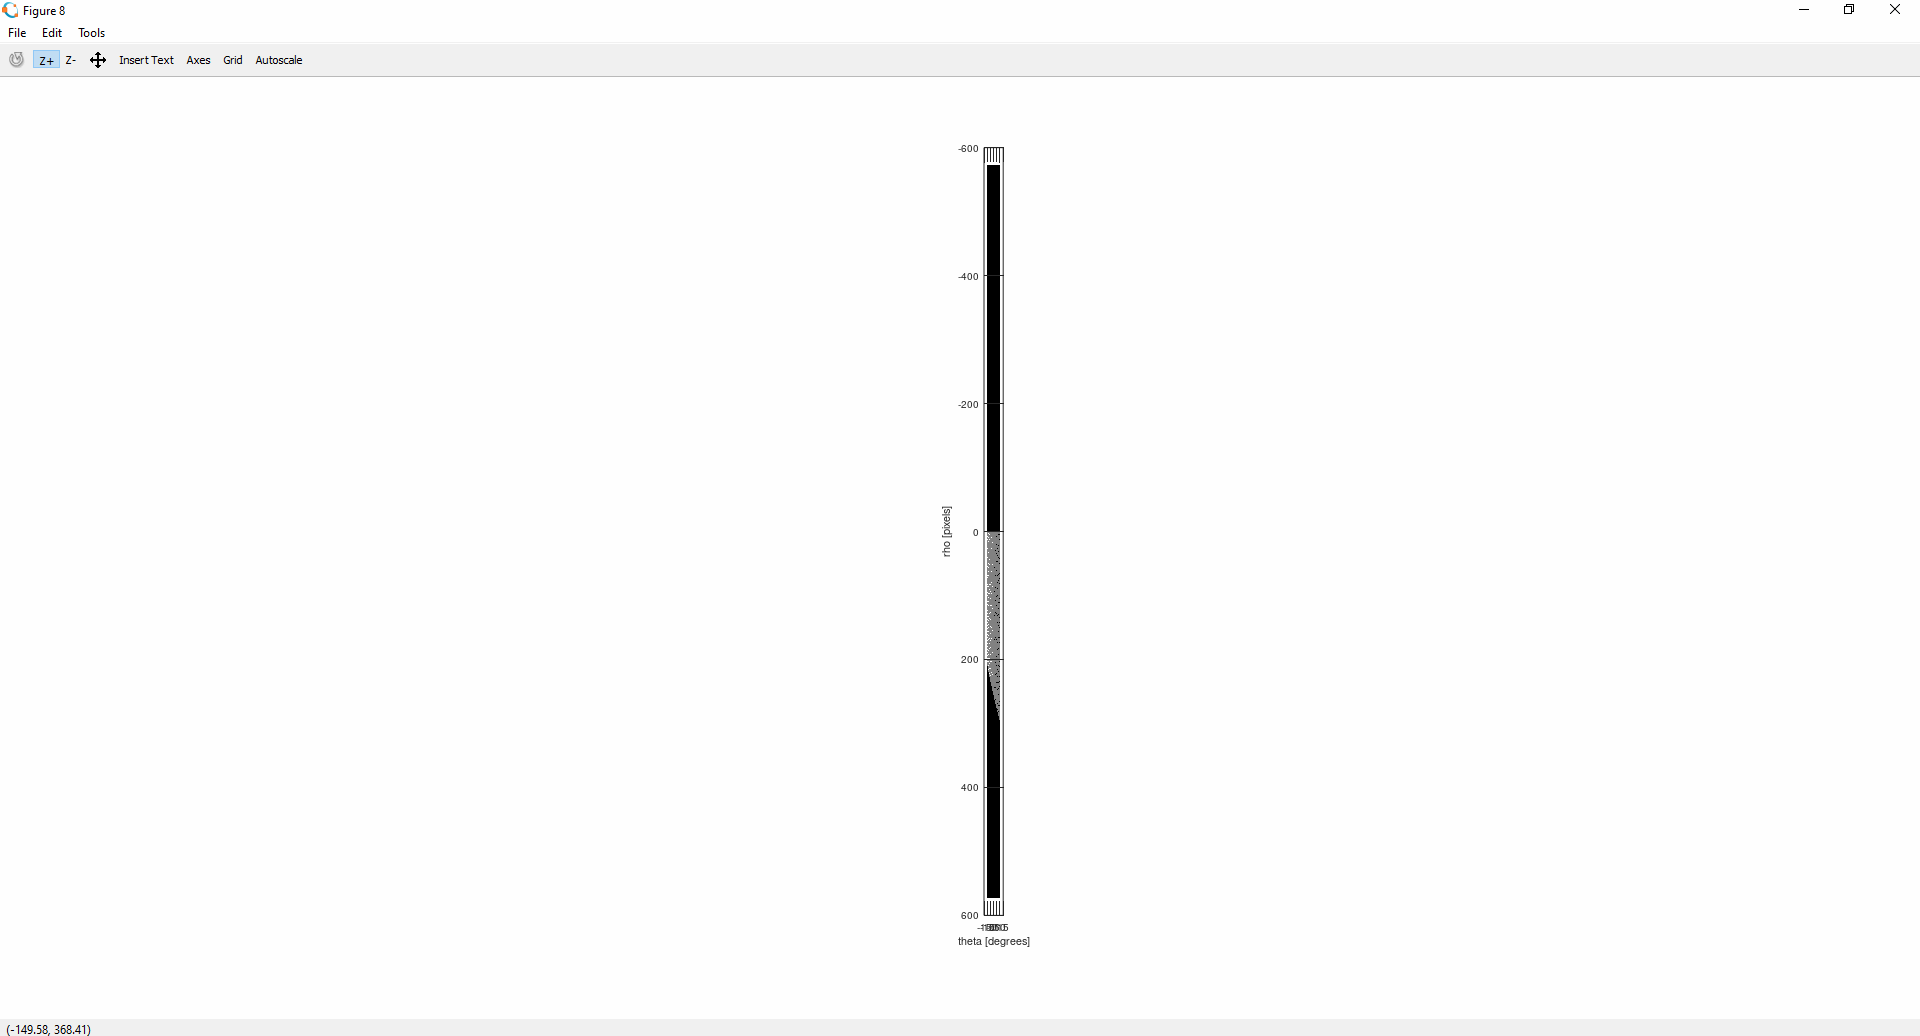
Hi, When plotting images using imshow, the resulting images resist expansion outside of their present boundaries under mouse control. Whilst in many cases it could be argued that the image does not warrant expansion, enabling it can reduce
visual stress and is common when wanting to inspect pixels. Maybe there is already a plot option for this? The following code generates the attached image, zzf_ed = eye(512,256); [H, theta, rho] = hough (zzf_ed, 'Theta', [-10:0.2:10]); imshow (mat2gray (H), [],"XData",theta,"YData",rho); axis on; xlabel("theta [degrees]"); ylabel("rho [pixels]"); There is a sequence of mouse and button operations that seem to do most of what I am after but are a very cumbersome way of achieving it. This involves using the Tools menu on the figure and enabling mouse zoom. This then enables me to
expand the axes of the plot across the figure window and then by zooming in on the image I can achieve some improvement in zoom. It’s not really giving the same outcome as just dragging the corners of the image to form a new plot boundary for the figure, which
is what I was expecting to be able to do. Also, a right-click figure copy function would be handy. I am using W10 and Oct 5.1.0. Regards Joe Joe Tusek
(BE MBA) |
![]() imageplot_narrow.png
imageplot_narrow.png
Description: imageplot_narrow.png
| [Prev in Thread] | Current Thread | [Next in Thread] |