On Tue, Feb 5, 2019 at 2:12 PM Kyle Firestone <address@hidden> wrote:
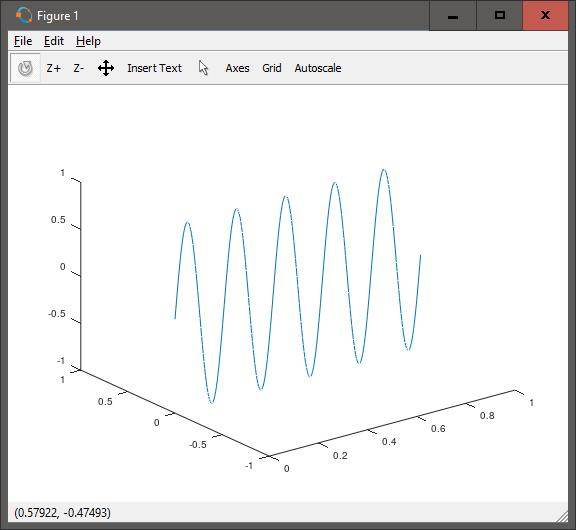
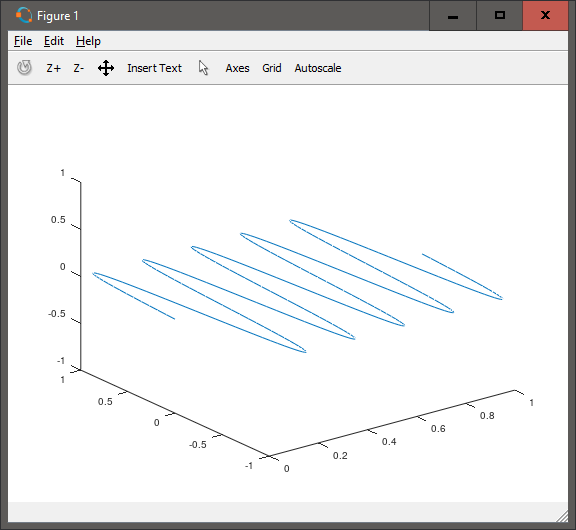
To Whom it Concerns:I am trying to use the Comet3 function to animate several functions and I keep running into an issue when trying to plot a simple sine wave. I have set up my variables as such:>> t = 0:0.1:10*pi;>> r = linspace (0, 1, numel (t));>> z = linspace (0, 1, numel (t));And the plots I am trying to animate are:plot3 (z, r*0, sin(t));plot3 (z, sin(t), 0*r);As you can see, the plot 3 function does not return any issue:However, using the "comet3" command in place of "plot3" yields the following error:>> t = 0:0.1:10*pi;>> r = linspace (0, 1, numel (t));>> z = linspace (0, 1, numel (t));>> plot3 (z, sin(t), 0*r);>> comet3 (z, sin(t), 0*r);error: axis: LIMITS(5) must be less than LIMITS(6)error: called fromaxis>__axis__ at line 328 column 11axis at line 158 column 7comet3 at line 77 column 5I attempted to fix the axes manually with the axis command but was not able to correct this. Please let me know if you are able to help me fix this issue. Thank you!Kyle M. Firestone
the problem is that you are sending it zeroes for the 3rd dim.
try
comet3 (z, sin(t), cos(t).^2 .*r);