[Date Prev][Date Next][Thread Prev][Thread Next][Date Index][Thread Index]
Subplots not drawing correctly.
|
From: |
IMacaulay |
|
Subject: |
Subplots not drawing correctly. |
|
Date: |
Wed, 24 Oct 2018 16:43:26 +0100 |
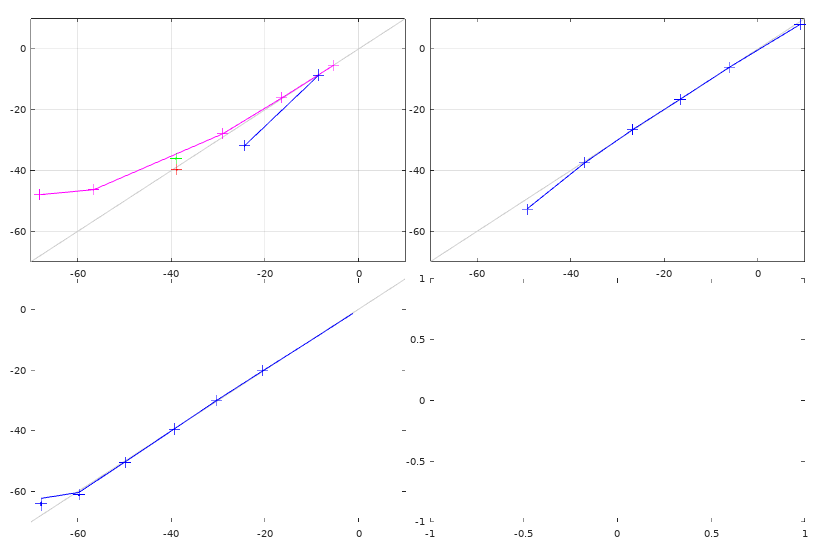
I've been having a problem with subplots.  Quite often, when I try to
plot multiple axes in one figure window, one or more of the axes will
fail to draw properly.  This generally takes the form of the axes
themselves being missing (labels, plotted data, &c., usually present),
grid lines being missing, or tick marks extending across the whole
axes.  I've attached and example (this is towards the worse end of the
spectrum). The behaviour appears to be similar with QT (which I
usually use) and FLTK; Gnuplot doesn't suffer from this, but has other
issues which rule it out, for me.  Any suggestions, please, or
work-arounds more practical than only ever plotting one thing in a
window?

I'm using 4.2.2, dated 13th March '18, under Lubuntu 18.04 LTS (NB,
Lubuntu, not Ubuntu).  The problem also existed with 16.04 LTS, and
whatever build of Octave I had prior to March.

Thanks,
 octave_plot.png
Description: PNG image
- Subplots not drawing correctly.,
IMacaulay <=
- Re: Subplots not drawing correctly., withaar, 2018/10/25
- Re: Subplots not drawing correctly., IMacaulay, 2018/10/26
- RE: Subplots not drawing correctly., Reed, Darren K. (MSFC-ER42), 2018/10/26
- Re: Subplots not drawing correctly., withaar, 2018/10/26
- Re: Subplots not drawing correctly., IMacaulay, 2018/10/29
- Re: Subplots not drawing correctly., Doug Stewart, 2018/10/29
- Re: Subplots not drawing correctly., withaar, 2018/10/29