[Date Prev][Date Next][Thread Prev][Thread Next][Date Index][Thread Index]
histogram with logscale ...
|
From: |
address@hidden |
|
Subject: |
histogram with logscale ... |
|
Date: |
Thu, 30 Nov 2017 10:07:02 +0100 (CET) |
Dear listmembers,
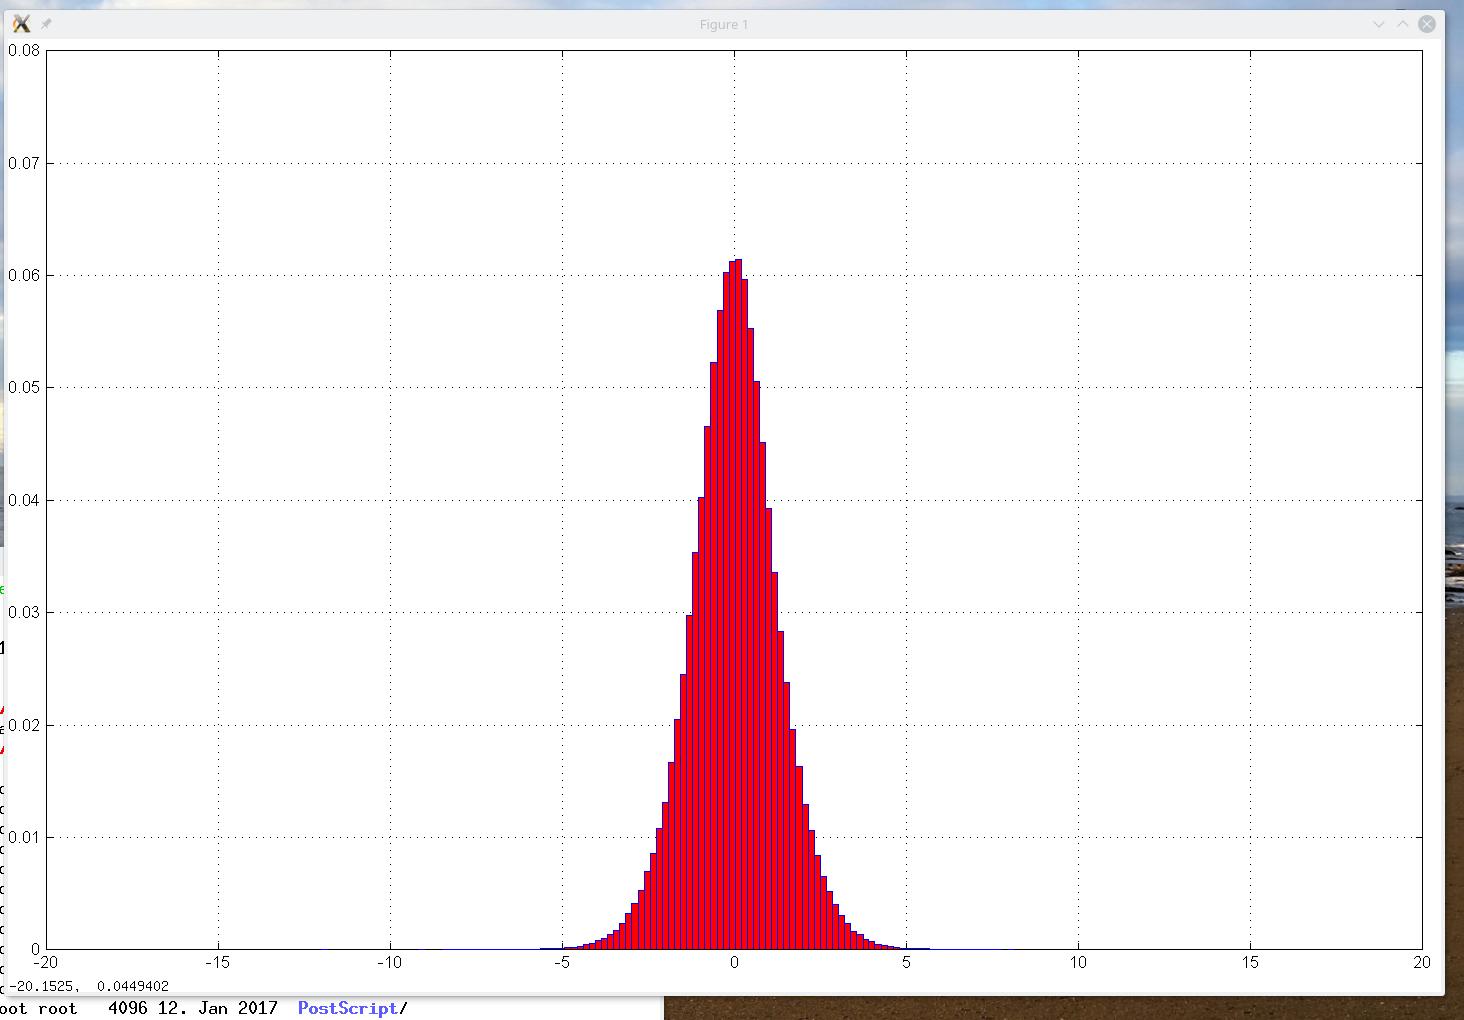
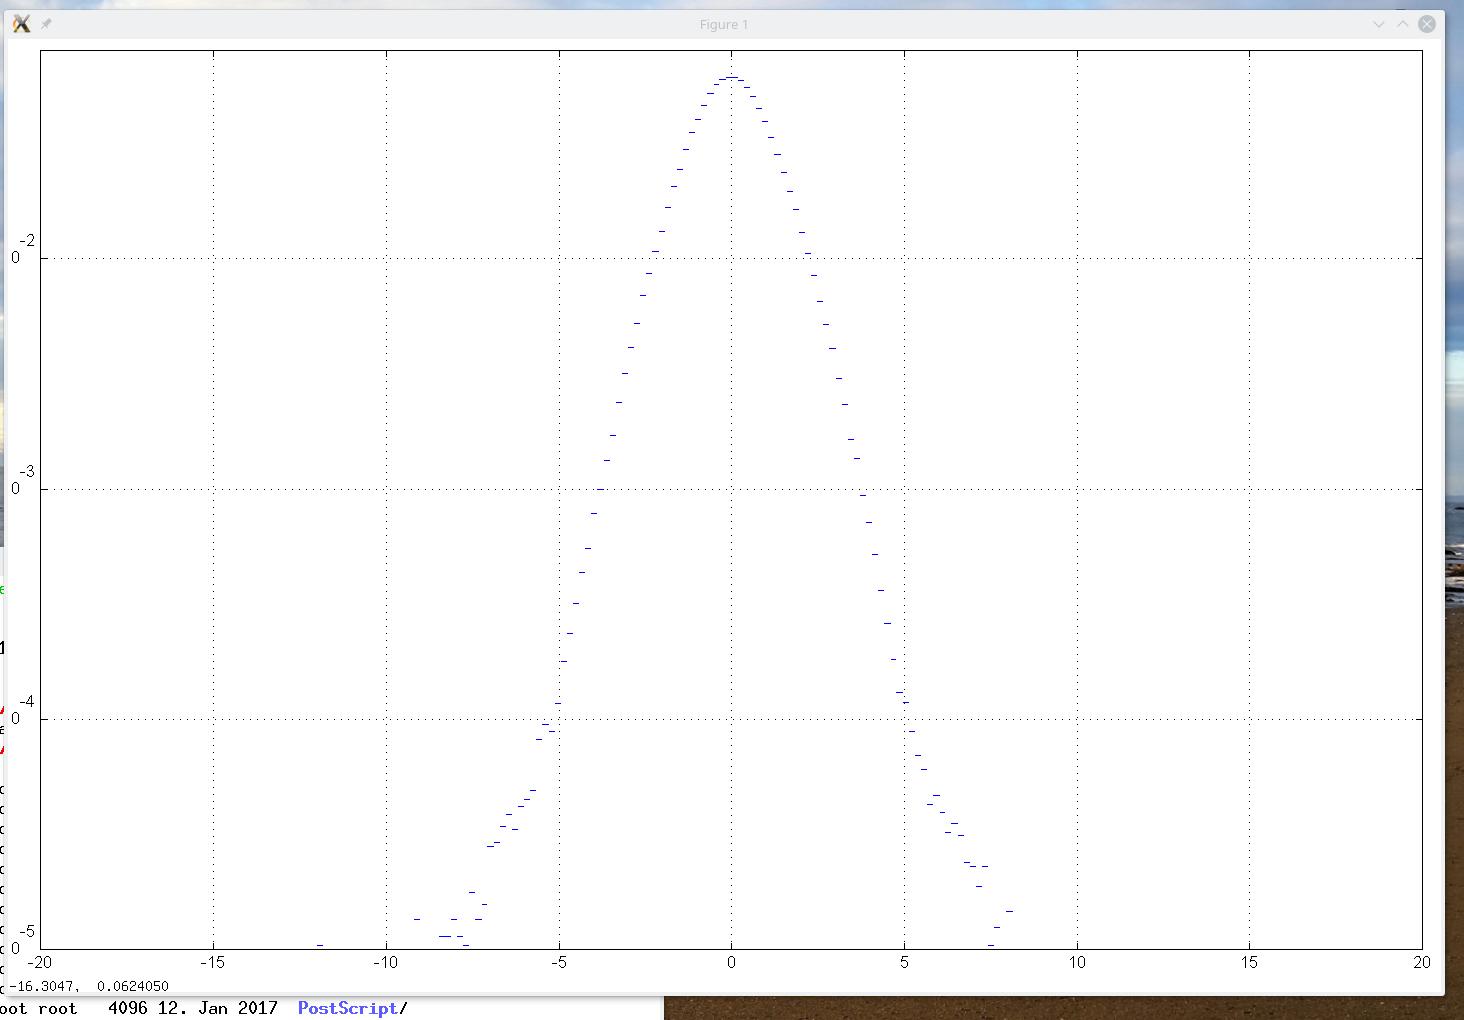
1.) trying to achieve a logscaling on the y-axis of a plot using "hist" gives
me the result as attached in "Screenshot_histogram_logscale.jpg". The only
difference between both commands consists of the additional setting
set (gca,'yscale', 'log');
Could some kind soul suggest a way how to get the same coloured bargraphs as in
the linear y-axis case?
2.) Is there any means to dump the gnuplot-parameter data that are piped to
gnuplot into a file? I tried the "rough" way by renaming the corresponding
binary and writing stdout from octave into a file, however, this did not yield
the expected results. The reason for this: I need modifications to the graph,
straightforward achievable through gnuplot directly, impossble (much effort at
least ....) through octave.
Thank you very much for your efforts,
best regards
Dieter Jurzitza
 Screenshot_histogram_linscale.jpg
Description: JPEG image
Screenshot_histogram_logscale.jpg
Description: JPEG image
- histogram with logscale ...,
address@hidden <=