[Date Prev][Date Next][Thread Prev][Thread Next][Date Index][Thread Index]
Re: 2 Y-axes in the same figure
|
From: |
Eduardo J. Adam |
|
Subject: |
Re: 2 Y-axes in the same figure |
|
Date: |
Tue, 18 Oct 2011 17:04:22 -0300 |
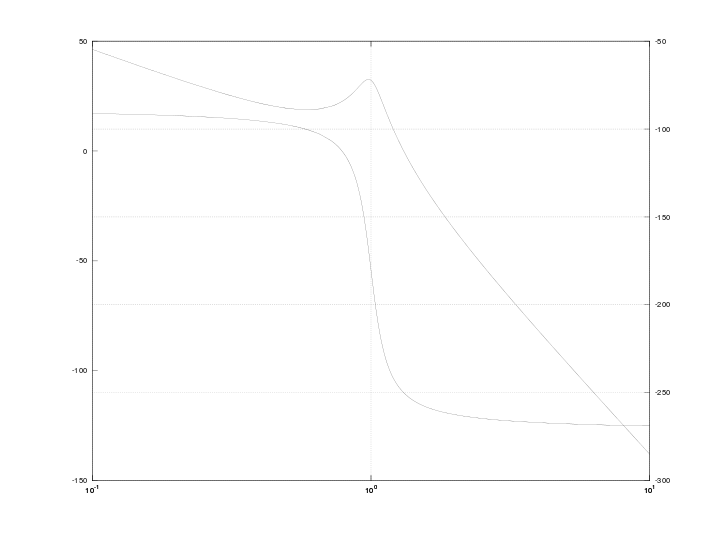
Great solution.
clear all, clf
K=1; n=K; d=[1 0.2 1 0];
gs=tf(n,d);
[mag_gs,pha_gs,w]=bode(gs);
mag_gs_db=20*log(mag_gs);
h = plotyy(w,mag_gs_db,w,pha_gs);
set (h, 'xscale', 'log'); grid
But, (always there is a but),
1. I have the following message,
>>>warning: create_set is obsolete and will be removed from a future version of Octave, please use unique instead
And,
2. Why I don't have a semilogx grid. Please, compera the x-axis in the original figure with this figure. I don't have the tipical division of semilog diagram

2011/10/18 Michael Goffioul
<address@hidden>
On Tue, Oct 18, 2011 at 8:34 PM, Eduardo J. Adam <
address@hidden> wrote:
> Wowww.
> But It is almost the solution. Look, it is a semilogx with 2 Y-axes.
h = plotyy(...);
set (h, 'xscale', 'log');
Michael.
--
Dr. Eduardo J. Adam
Prof. Adjunto Instrumentación y Control de Procesos
Facultad de Ingeniería Química
Santiago del Estero 2654, (S3000AOJ), Santa Fe, SF, Argentina
Tel. +54 (0342) 457-1167 Int. 2742
http://www.fiq.unl.edu.ar/control/index.php?page=adam
- 2 Y-axes in the same figure, Eduardo J. Adam, 2011/10/18
- Re: 2 Y-axes in the same figure, Martin Helm, 2011/10/18
- Re: 2 Y-axes in the same figure, Eduardo J. Adam, 2011/10/18
- Re: 2 Y-axes in the same figure, Michael Goffioul, 2011/10/18
- Re: 2 Y-axes in the same figure,
Eduardo J. Adam <=
- Re: 2 Y-axes in the same figure, Michael Goffioul, 2011/10/18
- Re: 2 Y-axes in the same figure, Eduardo J. Adam, 2011/10/18
- Re: 2 Y-axes in the same figure, Michael Goffioul, 2011/10/18
- Re: 2 Y-axes in the same figure, Eduardo J. Adam, 2011/10/18
- Re: 2 Y-axes in the same figure, Eduardo J. Adam, 2011/10/20
- Re: 2 Y-axes in the same figure, Michael Goffioul, 2011/10/21
- Re: 2 Y-axes in the same figure, Liam Groener, 2011/10/21
- Re: 2 Y-axes in the same figure, Eduardo J. Adam, 2011/10/21
- Re: 2 Y-axes in the same figure, Eduardo J. Adam, 2011/10/21
- Re: 2 Y-axes in the same figure, Michael Goffioul, 2011/10/21
