|
From: | Juan Pablo Carbajal |
Subject: | Re: change position of x-axis |
Date: | Tue, 11 Oct 2011 16:28:39 +0200 |
On Tue, Oct 11, 2011 at 2:44 PM, Ben Abbott <address@hidden> wrote:
On Oct 11, 2011, at 8:29 AM, Vlăduţ Frăţiman wrote:<graf.png>Thanks!
I already try'it that but seem to be an bug. My plot show an intrerupted line and old axis don't disspear.
I use octave 3.2.1 on Ubuntu 11.04. Plots are rendered with gnuplot.
I put an image as attachament to see what i mean.It works correctly for me. Perhaps we're doing something else differently that it producing a different result?The following works for me.
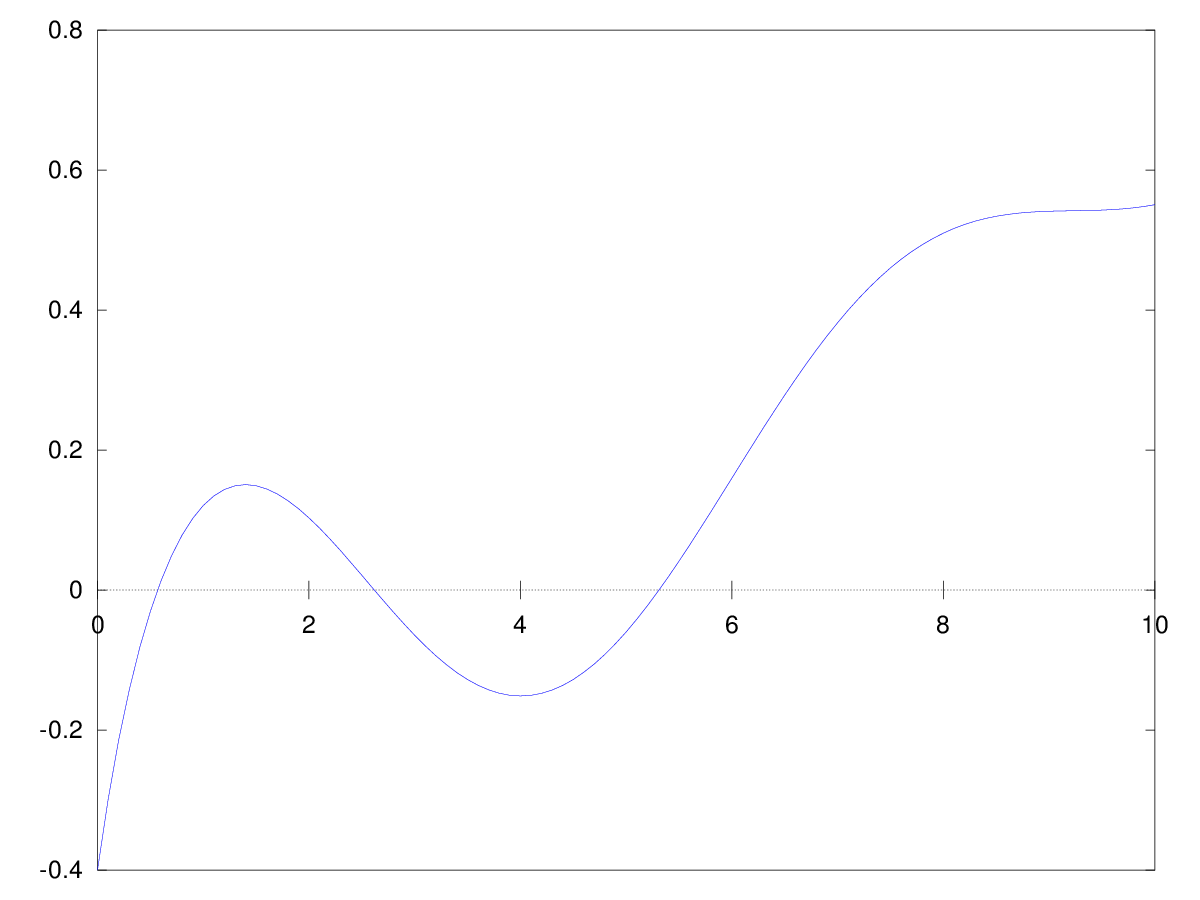
close allclear allx = 0:0.1:10;y = sin(x)./(1+x) + x*0.1 - .4;
plot (x, y);print test.png
set (gca, "xaxislocation", "zero")
preview test.pngDoes this work for you?Ben_______________________________________________
Help-octave mailing list
address@hidden
https://mailman.cae.wisc.edu/listinfo/help-octave
Ben,
please add the line
set (gca, "box", "off")
to see the remainding of the axis. This problem is even in the plot "polar" when the box is switched off.
--
M. Sc. Juan Pablo Carbajal
-----
PhD Student
University of Zürich
http://ailab.ifi.uzh.ch/carbajal/
[Prev in Thread] | Current Thread | [Next in Thread] |