[Date Prev][Date Next][Thread Prev][Thread Next][Date Index][Thread Index]
question
|
From: |
Ubald Bauer |
|
Subject: |
question |
|
Date: |
Sat, 18 Dec 2010 10:54:19 +0100 |
Hello,
I am using Octave for plotting mathematical functions for a high school paper.
I have a question about that:
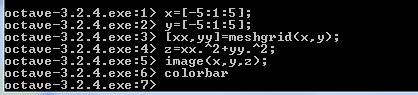
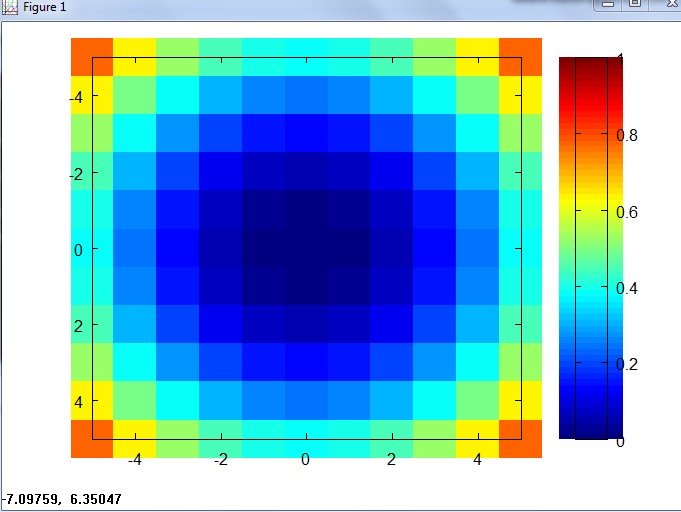
I am plotting z=x^2+y^2 with the function image like in the attachment.
When adding the colorbar, it only reaches from 0 to 1 (see attachment number 2), although the it must be from 0 to 50.
What is my fault? Can you please help me.
Kind regards,
Ubald Bauer
 tasks.PNG
Description: PNG image
result.PNG
Description: PNG image