[Date Prev][Date Next][Thread Prev][Thread Next][Date Index][Thread Index]
pcolor and patch
|
From: |
John W. Eaton |
|
Subject: |
pcolor and patch |
|
Date: |
Thu, 25 Feb 2010 00:05:31 -0500 |
On 24-Feb-2010, RENOO wrote:
| This is my first post here as I am starting using Octave and I must confess
| that I am very happy of the quality of this software so far:clap:
|
|
| However, there is one feature I can not make.
|
| I would like to plot my data using a pcolor and then add a patch to hide a
| part of those data.
| I assumed that using the contourf command is equivalent at finding the
| cordinates of the isoline with the contourc command and then applying the
| patch command.
|
| So here is a simple example of my script :
|
| [X,Y,Z] = peaks(50);
| pcolor(X,Y,Z); shading flat
| hold on
| contourf(X,Y,Z,[1 1],'k')
|
| error: patch: property value is missing
| error: evaluating if command near line 205, column 3
| error: called from `contourf:parse_args' in file
| `/usr/share/octave/3.0.5/m/plot/contourf.m'
| error: called from `contourf' in file
| `/usr/share/octave/3.0.5/m/plot/contourf.m'
|
| So I tried without any properties :
| octave:14> contourf(X,Y,Z,[1 1])
| error: gnuplot (as of v4.2) only supports 2D filled patches
| error: evaluating if command near line 537, column 9
| ....
|
| google ( and the message error ) told me it comes from gnuplot backend.
|
| So I tried from this http://old.nabble.com/FLTK-howto--td27703703.html post
|
| backend("fltk")
|
| and this leads me to the following error message :
|
|
| octave3.2:3> [X,Y,Z] = peaks(50);
| octave3.2:4> pcolor(X,Y,Z); shading flat
| octave3.2:5> hold on
| octave3.2:6> contourf(X,Y,Z,[1 1],'k')
| error: mx_el_lt: nonconformant arguments (op1 is 1x2, op2 is 0x0)
| error: evaluating argument list element number 1
| error: evaluating argument list element number 1
| error: called from:
| error: /usr/share/octave/3.2.2/m/plot/__contour__.m at line 238, column 15
| error: /usr/share/octave/3.2.2/m/plot/__contour__.m at line 188, column 3
| error: /usr/share/octave/3.2.2/m/plot/contourf.m at line 73, column 5
|
| I am running octave
| octave3.2:6> version
| ans = 3.2.2
|
| and I also tried with QtOctave version 0.8.1 which runs octave
| octave:13> version
| ans = 3.0.5
|
| but in vain.
|
| Any help ?
You can avoid the nonconformant argument error by setting the level
argument to contourf to be something like [1, 1+eps] instead of [1, 1].
That's a bug, and I've checked in the following change:
http://hg.savannah.gnu.org/hgweb/octave/rev/f074aa6b2c80
But I don't think gnuplot 4.2 will work for this plot even with this patch:
error: gnuplot (as of v4.2) only supports 3D filled triangular patches
error: called from:
error: /home/jwe/src/octave/scripts/plot/__go_draw_axes__.m at line 592,
column 6
error: /home/jwe/src/octave/scripts/plot/__go_draw_figure__.m at line 102,
column 1
error: /home/jwe/src/octave/scripts/plot/gnuplot_drawnow.m at line 99,
column 5
I don't know whether later versions avoid this problem.
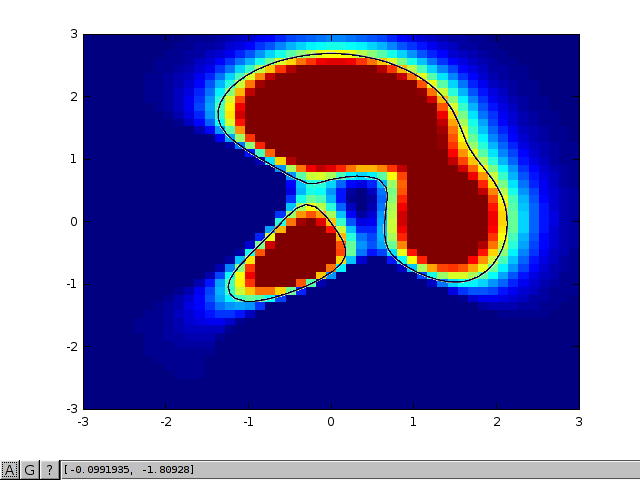
Using the fltk backend with the current sources, I get the first plot
attached below. I suspect that is not what you are looking for.
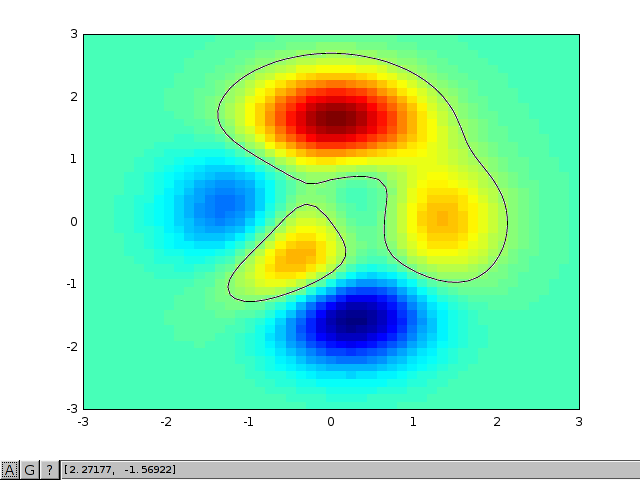
Using contour instead of contourf, I get the second attached plot. It
looks more reasonable, but I'm not sure whether that is the image you
want.
BTW, it is best to report bugs to the address@hidden mailing list.
jwe