Description: JPEG image
|
| From: | Renato S. Yamane |
| Subject: | Re: Setting grid with personalized scale |
| Date: | Thu, 26 Nov 2009 15:55:03 -0200 |
| User-agent: | Mozilla/5.0 (X11; U; Linux i686; pt-BR; rv:1.9.1.4pre) Gecko/20090915 Thunderbird/3.0b4 |
Ben Abbott wrote:
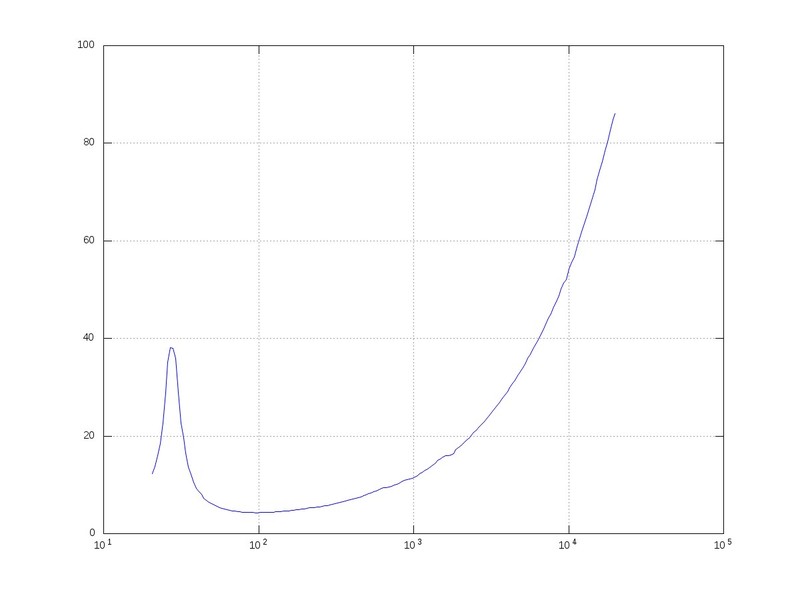
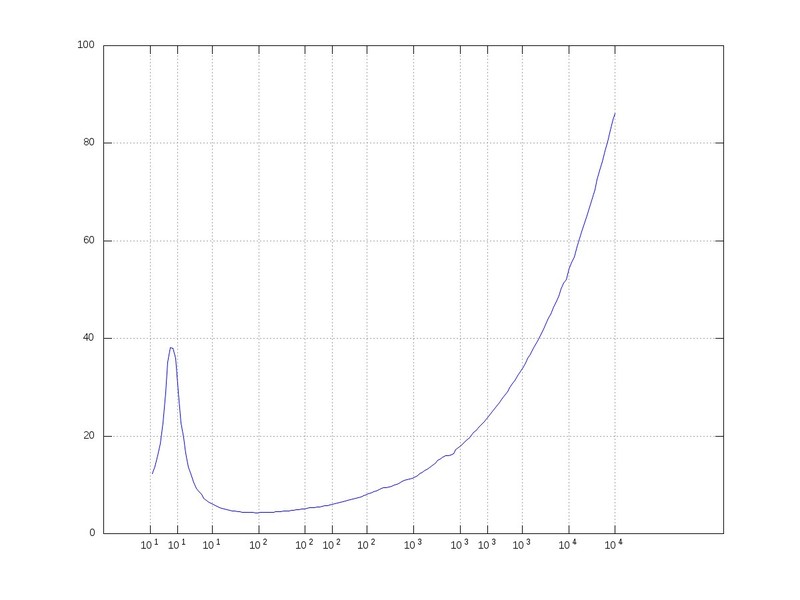
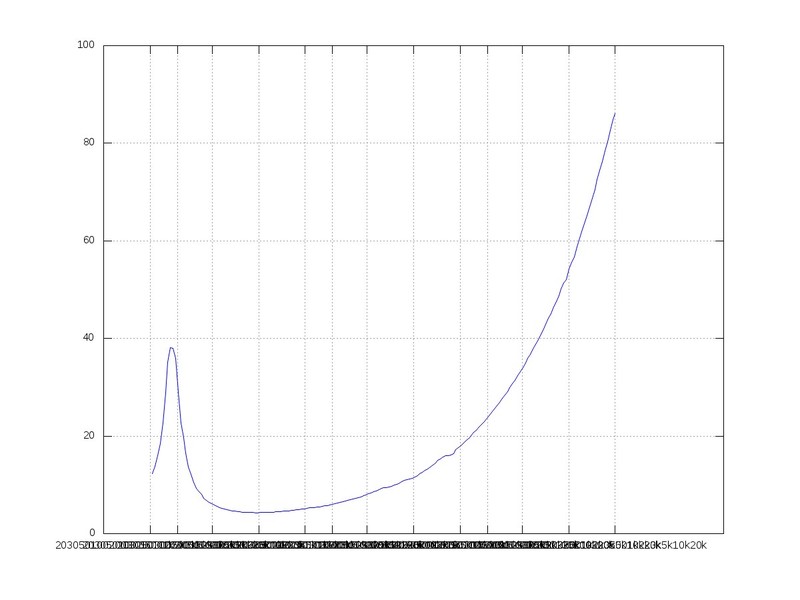
Renato S. Yamane wrote:On 25-11-2009 10:07, Ben Abbott wrote:clf x = 1:1000; semilogx (x, sqrt(x)) a = [1, 2, 3, 5]; xtick = [a, 10*a, 100*a, 1000];So, xtick is: 1, 2, 3, 5, 10, 20, 30, 50, 100, 200, 300, 500, 1000set (gca, 'xtick', xtick)What it does?set (gca, 'xticklabel', {'1','2','3','5','10','20','30','50','100','200','300','500','10k'})So sorry for this questions, I did it because I try change somethings in your suggestion but it don't work... Like this: - X-axis: 20, 30, 50, 100, 200, 300, 500, 1k, 2k, 3k, 5k, 10k, 20kThe "xtick" axis property defines where the tick marks are to be placed for the x-axis. The "xticklabel" property defines the text lables for each x-axis tick mark. For your example, try set (gca, "xtick", [20, 30, 50, 100, 200, 300, 500, 1000, 2000, 3000, 5000, 10000, 20000]); set (gca, "xticklabel", {"20", "30", "50", "100", "200", "300", "500", "1k", "2k", "3k", "5k", "10k", "20k"]); If that doesn't work, tell us what version of octave you are running. You'll need to be running 3.2.x for this to work.
Hi Ben, I'm using Octave 3.2.3 on Debian Squeeze.
See the graphs attached.

- standard_output.jpg = Standard output using semilogx;
- with_xtick.jpg = After use "set (gca, "xtick", [20, 30...]"
- with_xtick_label.jpg = After use "set (gca, "xticklabel", ["20", "30"...]

How you can see, the labels is not ok.

Regards,
Renato
![]() standard_output.jpg
standard_output.jpg
Description: JPEG image
![]() with_xtick.jpg
with_xtick.jpg
Description: JPEG image
![]() with_xtick_label.jpg
with_xtick_label.jpg
Description: JPEG image
| [Prev in Thread] | Current Thread | [Next in Thread] |