[Date Prev][Date Next][Thread Prev][Thread Next][Date Index][Thread Index]
dataaspectratio
|
From: |
J Schreiber |
|
Subject: |
dataaspectratio |
|
Date: |
Mon, 10 Aug 2009 14:33:01 +0200 |
|
User-agent: |
Thunderbird 2.0.0.14 (X11/20080505) |
Hi,

I would like to get plots where y and x axis have the same scale.

this works in matlab, unfortunately not in octave, both win and linux.

The ratio depends on the size of the figure window.
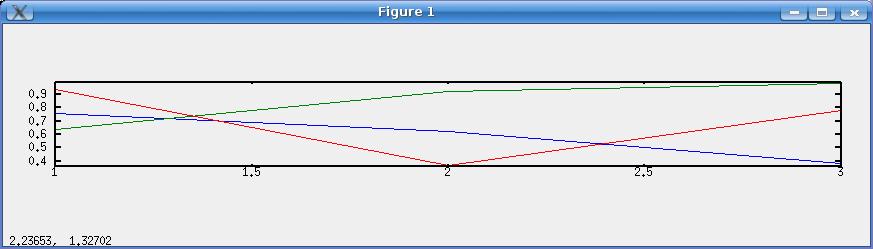
the following plot does fill the figure window, after the set command
the plot is centered in to the middle vertically,
(although the get  says, that it had 1 1 1 before)

the same when figurewindow is higher than wide.


octave:14> plot(rand(3))
octave:15> get(gca,'dataaspectratio')
ans =

   1   1   1

octave:16> set(gca,'dataaspectratio',[1 1 1])
octave:17> ver
----------------------------------------------------------------------
GNU Octave Version 3.0.0
GNU Octave License: GNU General Public License
Operating System: Linux 2.6.24-16-generic #1 SMP Thu Apr 10 13:23:42 UTC
2008 i686
----------------------------------------------------------------------

best regards

Jörg Schreiber
- dataaspectratio,
J Schreiber <=