[Date Prev][Date Next][Thread Prev][Thread Next][Date Index][Thread Index]
what's wrong with the plot?
|
From: |
Gunnar |
|
Subject: |
what's wrong with the plot? |
|
Date: |
Mon, 4 Apr 2005 12:26:42 +0200 |
|
User-agent: |
KMail/1.7.2 |
Hello.
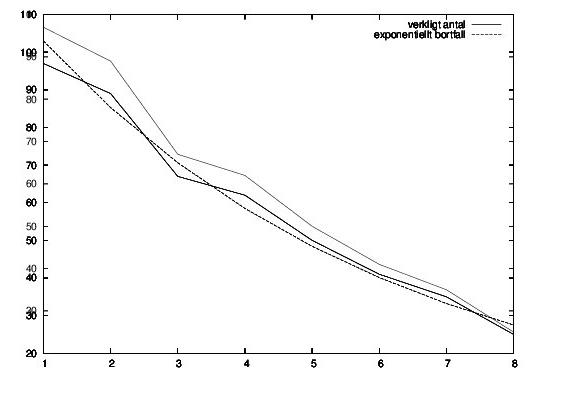
I'm using octave in linux, and I have created a plot with these commands
y=[97 89 67 62 50 41 35 25];
x=1:8;
koeff=polyfit(x,log(y),1);
realkoeff=exp(koeff)
yp=polyval(koeff,x);
gset terminal postscript eps
gset output 'antal2004.eps'
plot(x,y,';verkligt antal;',x,exp(yp),';exponentiellt bortfall;');
The result "antal2004.eps" looks fine in ghostview, it also looks fine when I
preview the image in LyX (the latex "frontend" which I'm using to write a
paper). N.B. this preview is the preview inside of LyX, not the
"View->postscript" way.
But when I produce a postscript file from LyX, then graphics is messed up.
The same messy graph is there if I print the file also.
The messy graph, well, hard to explain, so I attach a screenshot (enlarged)
Does anyone know what's wrong? I'm not even sure this is the right forum for
this question, but I guess at least someone can tell me if I've used gset in
a correct way.
Thanks,
Gunnar.
 trasig.jpeg
Description: JPEG image
- what's wrong with the plot?,
Gunnar <=