|
| From: | Robert Leach |
| Subject: | Re: scalograms |
| Date: | Wed, 25 Feb 2004 09:35:05 -0700 |
25.343978 -2.085245 -2.136900 -0.682384 5.673558 -4.957428 1.649203 3.350534 -4.942082 -0.540597 -5.084020 0.105989 6.198113 -2.109433 0.906470 1.450943 -0.630392 3.982748 -0.916697 -0.172604 -3.721954 ....
This is in the frequency domain. I ruled out the possibility that this was due to signal padding (by sending an unpadded signal (with a length equal to a power of 2) through). I also ruled out a suggestion given to me below.
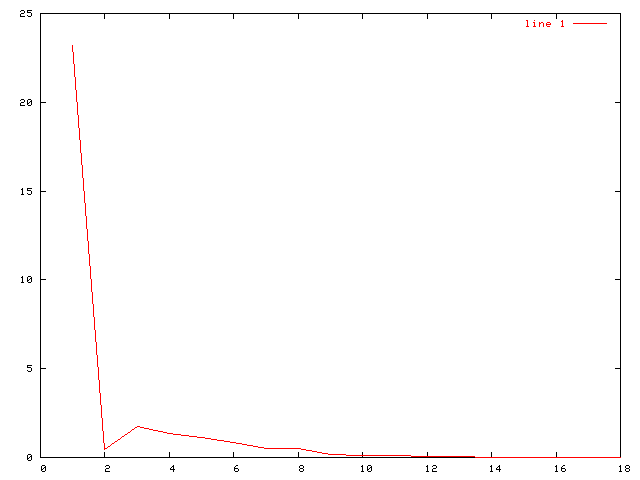
I'm beginning to believe that this has something to do with the inner workings of FWT_PO and I suspect an issue with Octave compatibility. Does anyone know if this outlier is an artifact due to compatibility of WaveLab802 with Octave? Note that I'm trying to reproduce data from a paper and they don't have such an errant data point and I'm using the same input. The low frequency graphs obtained via the inverse transform look good, but all my analyses have this outlier peak that flattens my scalogram.
I'd run into a compatibility issue a long time ago which involved a difference between MATLAB's and Octave's different reverse functions, so I know that compatibility issues exist. I fixed the reverse problem by writing a version specifically for the calls from WaveLab802. Anyone have any thoughts on what compatibility issue could be skewing the first value during a wavelet transform?
Here's what my scalograms look like:
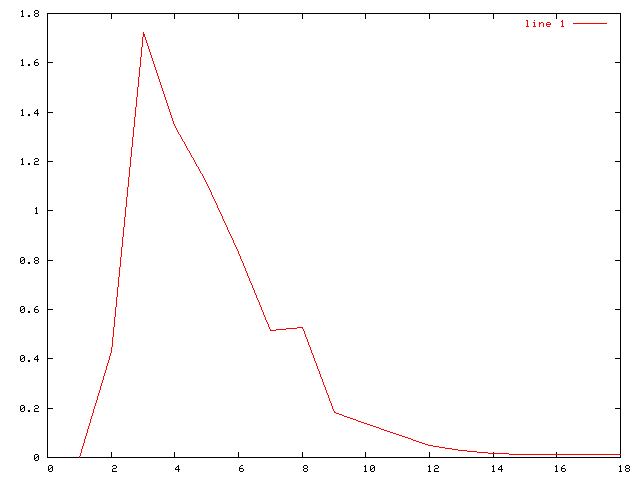
Here it is with a manual setting of the first point to zero (which is more what it SHOULD look like):
Thanks,
Rob

On Wednesday, February 18, 2004, at 08:01  PM, Doug Stewart wrote:
This is only a guess :-) but it looks like the spike is from the DC component of your input signal. It is mostly above 0. Find the average of the input signal and subtract it fron the input and see what the result is.Doug Stewart Robert Leach wrote:Hi,I have another question. Please excuse me if it's a dumb one. I'm doing daubechies wavelet transforms and am trying to reproduce results in a paper to be sure I'm getting it right. The plots of my low frequency extractions look right-on to what the paper has, but my scalograms look nothing like those in the paper.A point on a scalogram as I understand it is the sum of the coefficients at a particular 'level'. I figured out that I need to normalize the data, but all my plots have a spike going off the left side of the scalogram. Everything else is flat.What could I be doing wrong?Their y axis goes from 0 to 1, but mine varies. The one I'm looking at now goes from -4 to +4. I'm not sure I understand where those numbers are coming from. I'm using the same input signal as the paper. I assume they somehow recalculated the y axis markings. Do I need to convert my data like this? Does that matter to my scalogram? What difference does the y axis scale make if the low frequency plots look the same?Here's some graphic examples: This is my low frequency plot:---------------------------------------------------------------------- --and here's the scalogram...---------------------------------------------------------------------- --In the paper, they have a nice scalogram peak at 3.5 and a second smaller peak at 6. Plus their y axis goes to 150.Here's the code I'm using to calculate the scalogram: function [s]=makescalogram(wc) sqscales = log(size(wc,2)) / log(2); scales = floor(sqscales); s = zeros(1,scales); startscale = 1; starti = 1; sz = size(wc,2); sq = wc.^2; for curscale=startscale:scales endi = 2**(curscale); if(endi > sz) endi = sz end s(curscale) = (1/(2**curscale)) * sum(sq(starti:endi)); starti = endi + 1; end Rob ===================================================================== = Robert W. Leach = = Los Alamos National Lab = = Bioscience Division: Bioinformatics & Computational Biology Group = = MS M888 = = Los Alamos, NM 87545 = = address@hidden = =====================================================================
=====================================================================
= Robert W. Leach                                                   =
= Los Alamos National Lab                                           =
= Bioscience Division: Bioinformatics & Computational Biology Group =
= MS M888                                                           =
= Los Alamos, NM 87545                                              =
= address@hidden                                                 =
= Work: 505-667-2307                                                =
= Cell: 505-310-3759                                                =
=====================================================================
Work Calendar & To-Do List: http://66.93.220.101/phpicalendar/week.php?cal=Work
| [Prev in Thread] | Current Thread | [Next in Thread] |