The QT GUI Time Sink can take multiple inputs, but I (seemingly) have no way of controlling the display of each signal. I.e., one signal lilipo plot (stem plot) while the other would be the waveform with no stem plot.
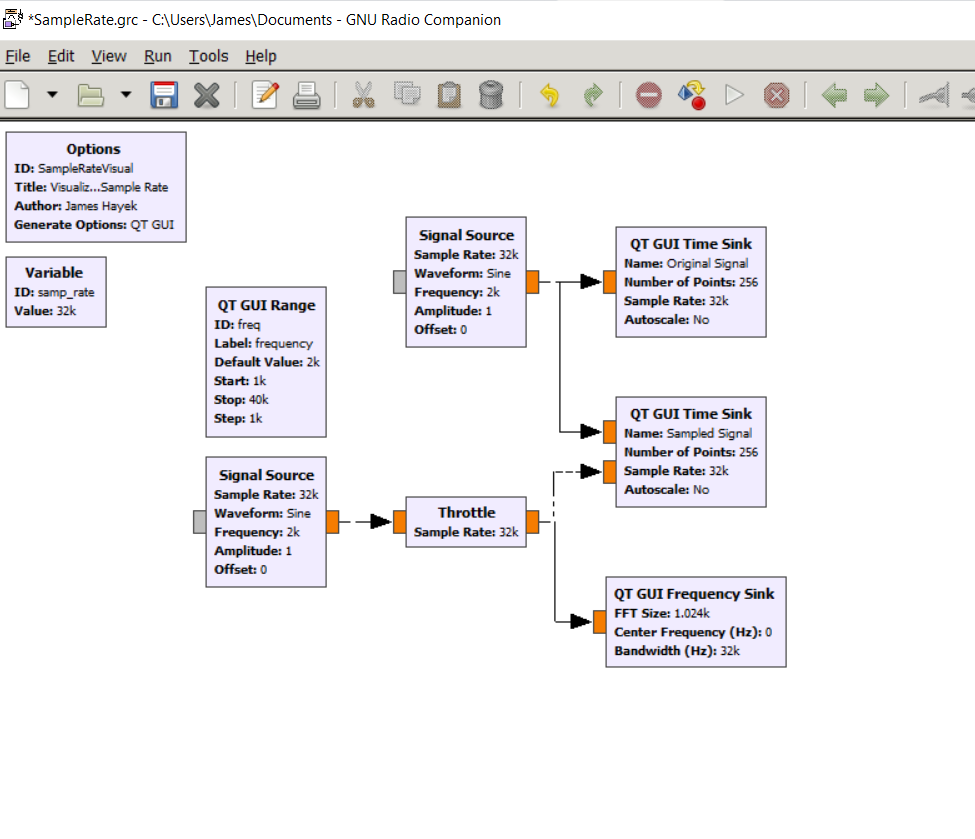
Is there a way to overlay all this together? What I have so far is shown below.
Thanks,
James G Hayek
James G Hayek
Youtube.com/JamesHayek